Product Analytics Check: Test an Assumption With Data You Already Have
You might already have the answer. Check the data you collect before you plan a new test, and decide what counts before you look.
Share
A product analytics check uses behaviour your product already logs to confirm or challenge one assumption before you commission a new test. You write down the number you expect, pull the real one from a tool such as Amplitude, PostHog or Mixpanel, and compare. It takes about a day, costs nothing, and gives you directional evidence: what happened, not what caused it.
Key takeaways
Write the metric, group, period and pass signal before you open a dashboard.
Past data shows things happening together, not cause. Microsoft's experimentation team called post-hoc analysis "mostly limited to the identification of correlations" (Kohavi et al., 2009).
"Day 30 retention" can mean two numbers. Amplitude and Mixpanel both separate returning on day 30 from returning on or after day 30.
Check 20 segments at a 5% false-positive rate, and the odds that at least one looks like a winner by luck are about 64%.
With 100 users per group, a gap between two retention rates must be about 14 points before you can tell it from noise.
What is a product analytics check?
It is the cheapest test in the series: no recruiting, no build. You take an assumption under a product bet, such as "people who invite a teammate in week one stay longer," rewrite it as a number, and look it up.
Strategyzer's experiment library for Testing Business Ideas files this kind of work under "data analysis" discovery experiments. It has no card called a product analytics check. Its nearest relative, web traffic analysis, is rated 2 of 5 for cost and 2 of 5 for evidence strength (Strategyzer poster). Cheap and quick, but weaker than changing something on purpose.
It answers questions about adoption, frequency, sequence, retention and segments. If the behaviour isn't logged, start with a web traffic analysis or add the event and wait.
When should you use a product analytics check, and when not?
Use it first, whenever the assumption is about something your product already logs. It takes a day, costs nothing, and often settles the question or shows you the right question to ask.
Do not use it for products with very few users, where small numbers swing wildly. Do not use it for things you do not track, and do not assume an event means what its name says until you have checked. And if you need to show that a change caused a result, you need a split test, since past data can only show that two things happened together.
Which risk does it test, and how strong is the evidence?
This tests desirability: do existing users behave the way you assumed? The evidence is directional. It is real behaviour, but you are looking back, nothing was controlled, and you can only see what was logged.
That still beats a hunch. Kohavi and colleagues reported that, measured objectively, most ideas fail to improve the metrics they were designed to improve (Kohavi et al., 2009). A one-day check that kills a weak belief before a month of build is a good trade, especially when the metric is your north star metric. Our guide to choosing a product experiment explains why it is often the best first step.
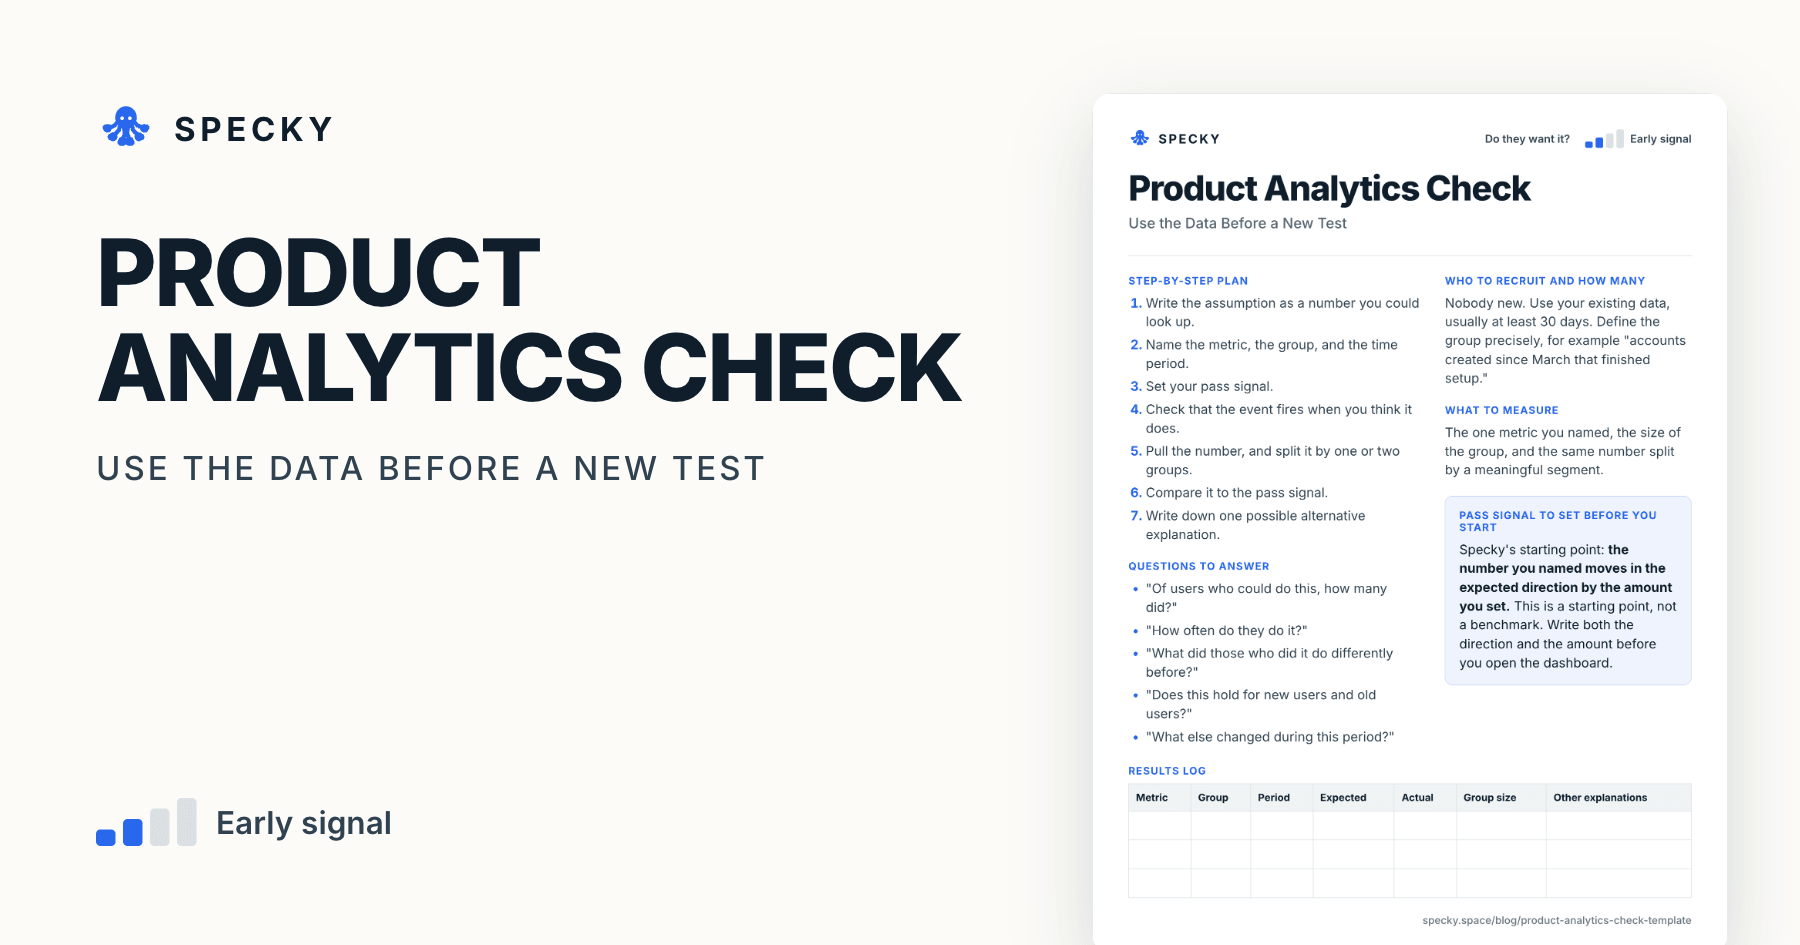
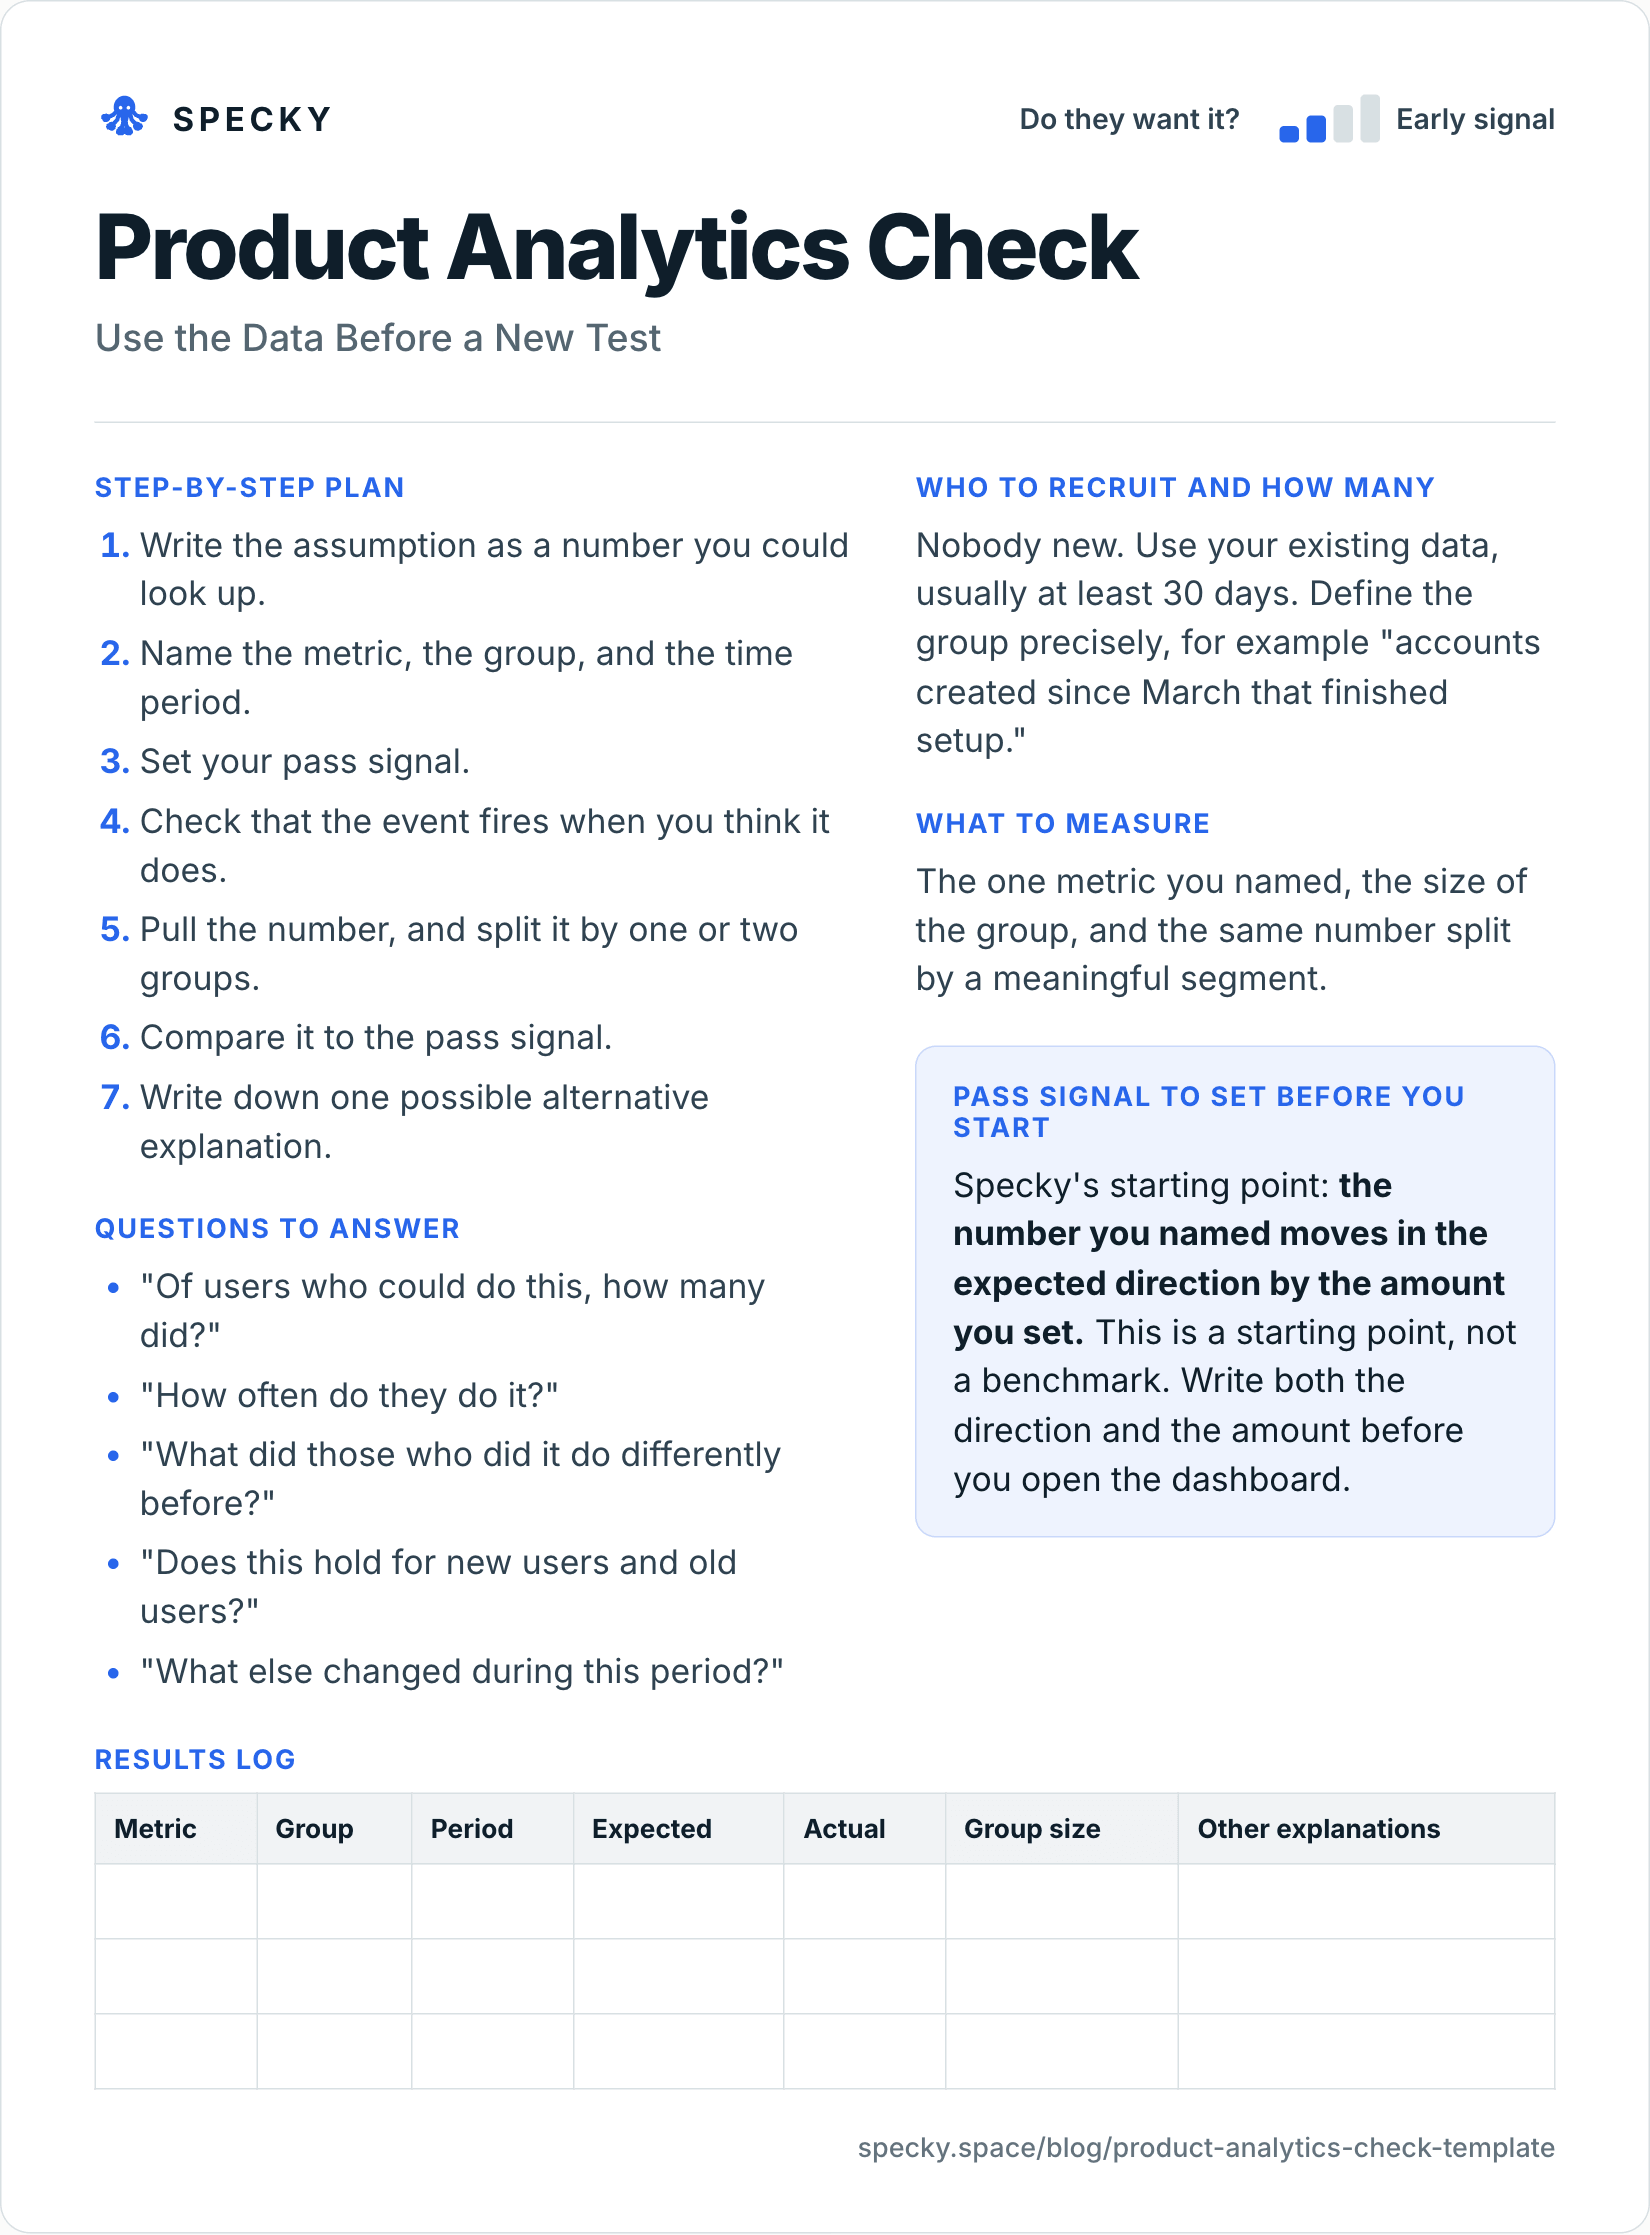
Product analytics check template (copy and use)
Open the image at full size, or copy the text version below.
Who to recruit and how many
Nobody new. Use your existing data, usually at least 30 days. Define the group precisely, for example "accounts created since March that finished setup."
Step-by-step plan
Write the assumption as a number you could look up.
Name the metric, the group, and the time period.
Set your pass signal.
Check that the event fires when you think it does.
Pull the number, and split it by one or two groups.
Compare it to the pass signal.
Write down one possible alternative explanation.
Questions to answer
"Of users who could do this, how many did?"
"How often do they do it?"
"What did those who did it do differently before?"
"Does this hold for new users and old users?"
"What else changed during this period?"
What to measure
The one metric you named, the size of the group, and the same number split by a meaningful segment.
Pass signal to set before you start
Specky's starting point: the number you named moves in the expected direction by the amount you set. This is a starting point, not a benchmark. Write both the direction and the amount before you open the dashboard.
Results log
Metric
Group
Period
Expected
Actual
Group size
Other explanations
How do you define the metric so the number means something?
Step 2 is where most checks go wrong. "Retention" sounds like one number, but analytics tools offer several:
Question you are asking
Amplitude
Mixpanel
Did they come back on exactly day 30?
Return On (formerly N-Day)
"On"
On day 30 or any time later?
Return On or After (formerly Unbounded)
"On or After"
Within a range, such as days 28-35?
Custom brackets, up to 100 per chart
Custom brackets
What starts the clock?
The starting event (cohort entry date)
The user's first "A event"
Sources: Amplitude, Mixpanel. PostHog builds the same chart from a start event and a return event (PostHog).
Three details change the answer:
"On or after" is always at least as high as "on." It adds everyone who returns later. Never compare one team's "on" with another's "on or after."
Rolling vs calendar days. In Mixpanel's rolling mode, day 1 means 24 to 48 hours after the first event. In calendar mode it means the next calendar day. A 23:50 signup can be day-1 retained in one and not the other.
First-time vs recurring. PostHog's first-time retention counts a user in a cohort only the first time they did the start event; recurring counts every period they did it. For "do new users stick?", use first-time.
Mixpanel leaves unfinished periods out of average retention. If the latest week looks like a collapse, check whether it has ended.
How do you check that an event means what its name says?
Step 4 takes about 30 minutes and saves days:
Do the action in a test account and watch the event arrive. Then do something close that should not fire it.
Compare a week of event counts with your own database. A gap of more than a few percent needs an explanation.
Find the day the event was first sent. Earlier users will look as if they never did it.
Filter out your team, test accounts and bots.
How many users do you need for a product analytics check?
No recruiting, but group size still decides whether the number means anything. The table uses the usual 95% approximation for a rate near 50%, the worst case:
Users per group
Margin on one rate
Margin on the gap between two groups
30
± 18 points
± 25 points
100
± 10 points
± 14 points
400
± 5 points
± 7 points
1,000
± 3 points
± 4 points
So set the pass signal above the margin: with 100 users per group, "5 points better" is indistinguishable from noise. Below about 100 per group, treat the check as a sketch that tells you what to ask in a customer interview, not a verdict.
How do you avoid fooling yourself with analytics?
Why can a gap shrink or reverse when you split the data?
Because a third factor can drive both numbers. In the extreme case, Simpson's paradox, an association appears, disappears or reverses once you split a population into groups (Stanford Encyclopedia of Philosophy). The classic example is Berkeley's graduate admissions, studied by Bickel, Hammel and O'Connell in 1975. Men were admitted at a higher rate overall, yet no department was biased against women: women had applied more often to departments that admitted fewer people.
In product data the usual third factor is plan type, company size, signup channel or tenure. That is why step 5 says to split by one or two groups.
How many slices is too many?
Each cut is another lottery ticket. Treat any 5% fluke as a finding, and the chance that at least one slice "wins" by luck is 23% with 5 slices, 40% with 10 and 64% with 20. Name your one or two splits in advance, and log any unplanned exciting slice as a new assumption, not a result. Then list releases, pricing changes and campaigns in the window: a spike that matches a launch email is about the email.
What does a product analytics check look like in practice?
This example is made up to show the method. A team building a design-review tool believes that users who invite a teammate in their first week are far more likely to stay. They say: "Invited users should retain at least 20 points better at day 30."
They pull the numbers. Users who invited someone in week one retained 61% at day 30, compared with 33% for those who did not, a gap of 28 points. But the group that invited was also mostly on paid plans. Among paid accounts alone, the gap falls to 9 points.
The first read passes, the second does not. They record it as inconclusive, and note that plan type may be behind it. The next step is a controlled test of a nudge to invite teammates.
Here is the same example with group sizes:
Group
Accounts
On paid plans
Day-30 retention
Invited in week one
420
80%
61%
Did not invite
1,580
About 33%
33%
Paid only: invited
336
100%
69%
Paid only: did not invite
514
100%
60%
The 28-point gap is far outside the noise (about ± 5 points), but it mixes inviting with paying. The paid-only gap of 9 points (margin about ± 6.5) is real but under half the 20 points needed.
Product analytics check vs web traffic analysis vs split test
Run them in that order: the analytics check tells you whether a belief deserves a split test.
What are the most common product analytics mistakes?
Opening the dashboard first. Decide the number before you see the data.
Believing event names. Check that "project_created" means what you think.
Confusing correlation with cause. People who do X may just be more committed to begin with.
Slicing until something works. If you check 20 segments, one will look great by chance.
Reporting the average. Averages hide who did what.
When it doesn't work: with fewer than about 100 users per group, for behaviour you don't log, and for any question that needs proof of cause.
Is it fair to users to analyse their behaviour this way?
Usually, if you stay inside what users agreed to. Check that your privacy notice covers product analytics and that consent choices were respected. Work with groups, not named people: a cohort chart is fine, a slide listing which customer did what is not.
How to run it in Specky
On the Assumptions page, click the note and choose Pick a test, then Analytics. Specky fills in the steps, the pass signal, and a one-day timeline.
Specky reads the numbers from connected analytics, such as PostHog, Mixpanel, Amplitude, or Pendo. There is no one-click run on this test: ask for the number in chat, or pull it yourself, then attach it as evidence.
If nothing is connected, paste the numbers with the source and date.
Click Start running, then record the result.
A pass shows as Early signal on the board, not Supported, because reading past data is directional.
What should you do with each outcome?
Supported (shows as Early signal): The data agrees. If you need to prove cause, run a split test. If you need to know why, run a few interviews.
Unclear: The result depends on the group. Note the groups, then decide which one matters.
Contradicted: Users do not behave as you assumed. Stop designing for that belief. Any bet resting on this note now shows as Contradicted.
Frequently asked questions
What is a product analytics check?
A product analytics check uses data you already collect to confirm or challenge a product assumption. You write the expected number, the group and the period first, then look it up in your analytics tool and compare. It is usually the fastest first step when the behaviour is already tracked.
Can analytics prove that a feature caused a result?
No. Past analytics can only show that two things happened together. People who use a feature may simply be more committed to begin with. To show that a change caused a result, you need a controlled experiment such as a split test, where users are randomly assigned.
How do I avoid fooling myself with analytics?
Write down the metric, group, and expected change before you open any dashboard. Then check that the event means what you think, and limit how many ways you slice the data. Name one or two splits in advance and treat any surprise slice as a new assumption to test.
What is the difference between N-day and unbounded retention?
N-day retention, which Amplitude now calls Return On, counts users who came back on one specific day, such as day 30. Unbounded retention, now Return On or After, counts users who came back on that day or later, so it is always equal or higher. Mixpanel uses the same split.
How much data do you need for a product analytics check?
Use at least 30 days and aim for a few hundred users in each group you compare. With 100 users per group, the gap between two rates has a margin of about 14 points, so only large differences mean anything. With 1,000 per group, the margin falls to about 4 points.