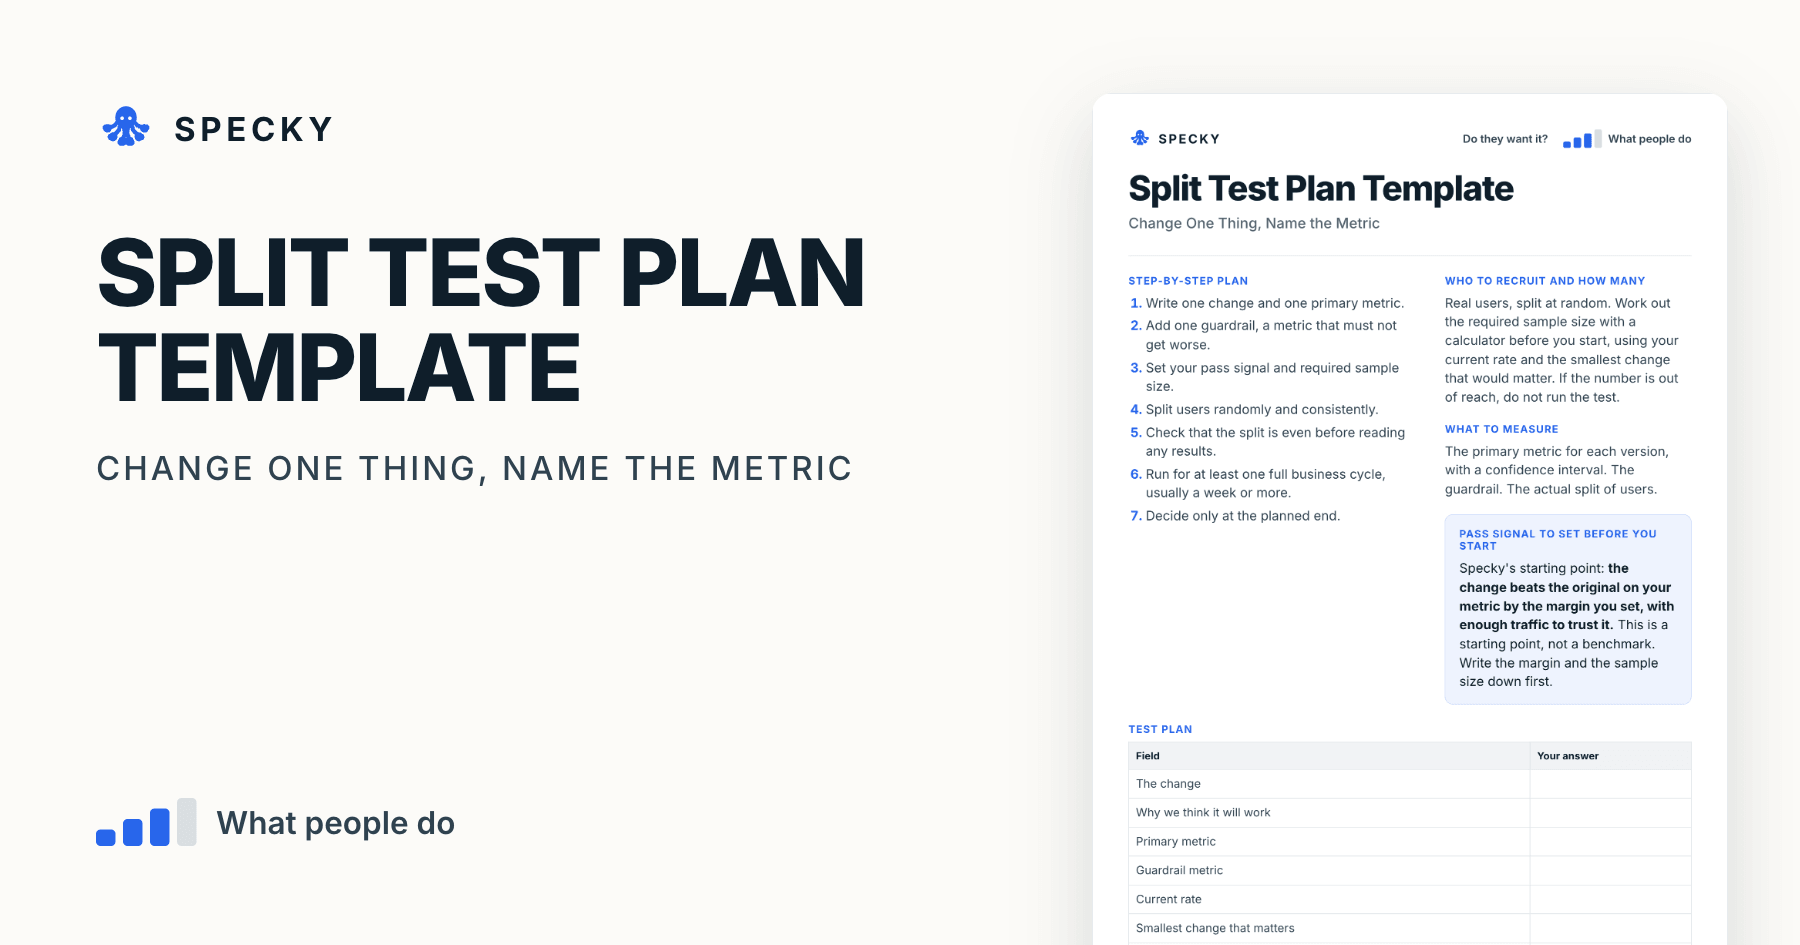
A/B Test Plan Template: Split Test One Change, Name the Metric
Most split tests go wrong before they start. Change one thing, name the metric first, work out the sample size, and do not peek.
Share
An A/B test plan template is a one-page plan you fill in before a split test: the one change, the primary metric, a guardrail metric, the sample size and the end date. A split test then shows that change to a random share of real traffic and compares the metric you named before it started. Write the plan first, because most split tests go wrong before launch.
Key takeaways
Most ideas lose. Bing's success rate on ideas was about 10-20%, and winners moved key metrics by 0.1% to 1.0% (Kohavi et al., KDD 2014).
Work out the sample size before you start. At a 12% conversion rate, detecting a 10% relative lift needs about 11,700 users per version at 95% confidence and 80% power (Evan Miller's calculator).
Do not peek. Testing after every visitor and stopping at the first "significant" result pushes the false positive rate from 5% to 26.1% (Evan Miller, 2010).
Name one guardrail, a metric that must not get worse.
What is a split test?
A split test changes one thing for a share of your real traffic and compares a metric you named before the test started.
It is the same thing as an A/B test: version A is the original (the control), version B has the change, and people are assigned at random. Because the change is the only systematic difference, a clear gap in the metric points to the change.
In David J. Bland and Alex Osterwalder's Testing Business Ideas, the split test is a "call to action" validation experiment, next to the landing page test and the presale. Strategyzer's poster rates it 2 out of 5 for cost, 3 out of 5 for run time and 3 out of 5 for evidence strength (Strategyzer experiment library).
When should you run a split test, and when not?
Use it when you have enough traffic and want to know if a specific change caused a result. It is the most reliable way to answer that. It can also surprise you. In their 2017 Harvard Business Review article, of a small change to how ad headlines were displayed at Bing, which produced results so strong that they set off an internal alert for being too good to be true. The idea had sat in the backlog for more than six months. It raised revenue by 12%, worth over $100 million a year in the US alone.
That story is the exception. In a 2014 paper, Kohavi and colleagues wrote that most Bing experiments fail, and that exceptionally strong results call for Twyman's law: "Any figure that looks interesting or different is usually wrong!"
Do not use it with low traffic. If you would need many months to reach enough people, use a usability test or interviews. Do not use it to explore. It only compares options you already have. For a deeper look, read our longer guide to A/B testing for product managers.
Which risk does it test, and how strong is the evidence?
This tests desirability: does this version make people do more of what you want? The evidence is behaviour, from real people who do not know they are in a test. It measures what happens over the period of the test, so it can miss long-term effects. See our guide to choosing a product experiment.
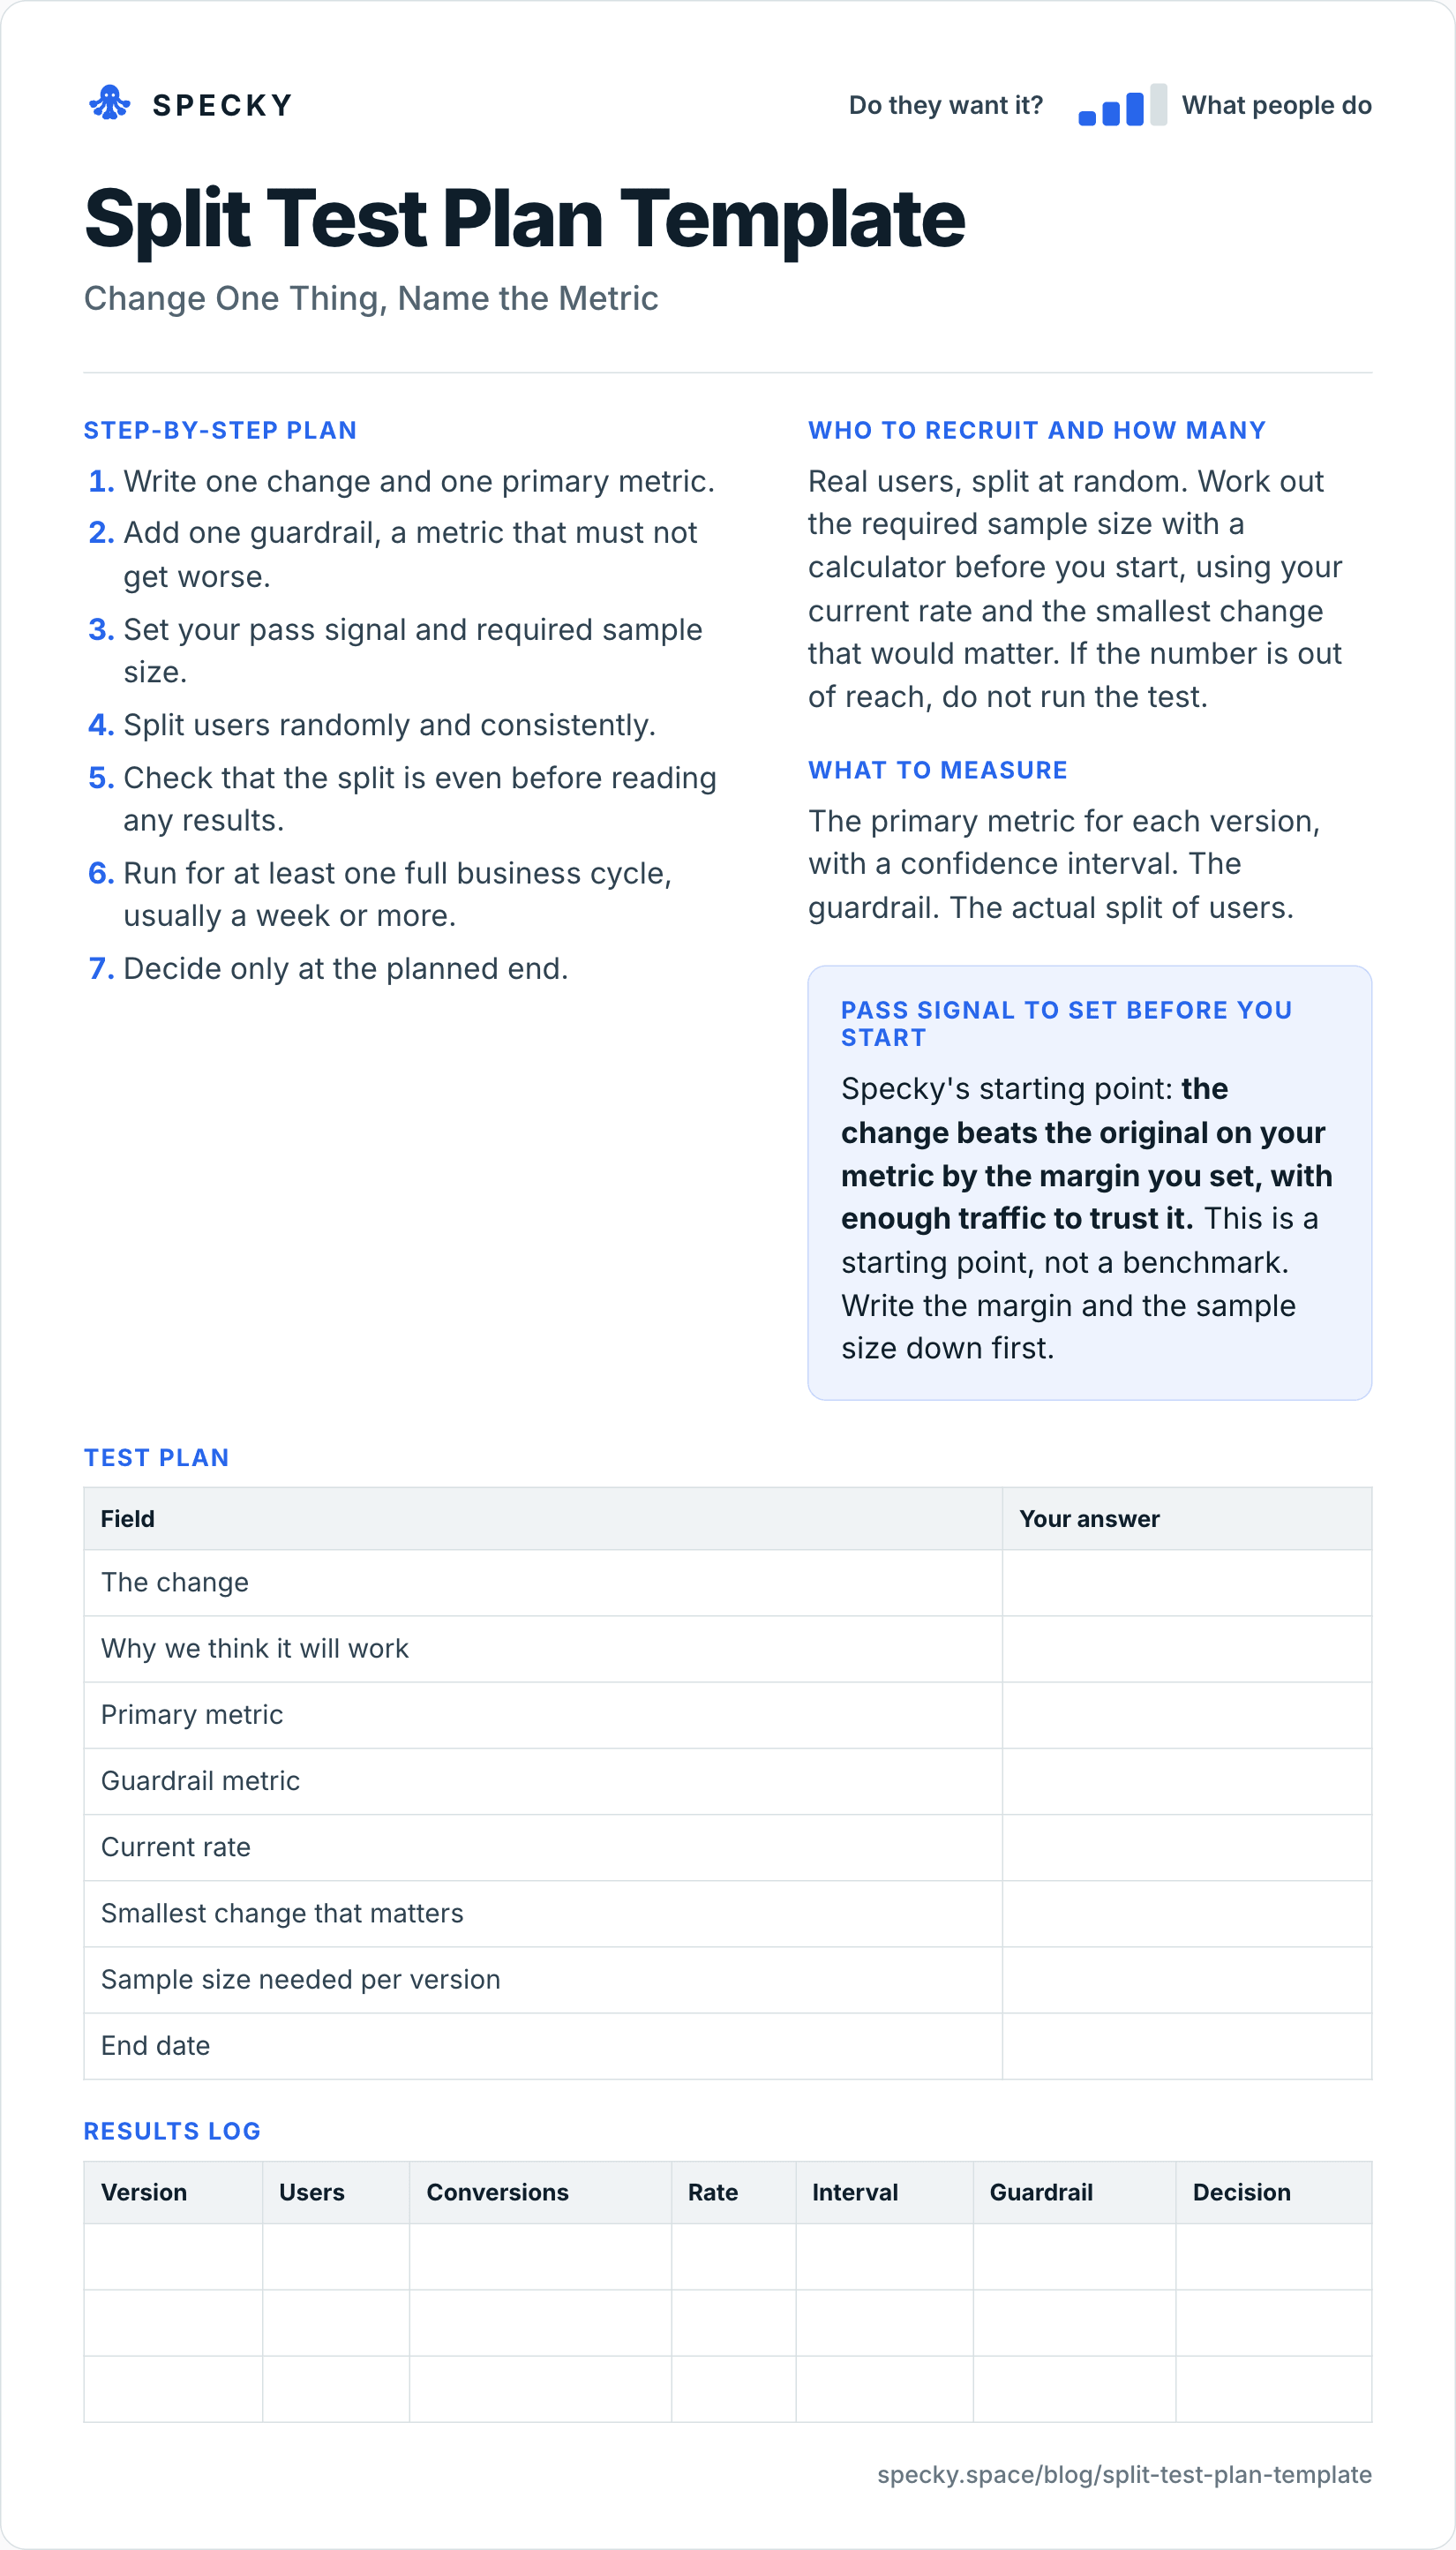
A/B test plan template (copy and use)
Open the image at full size, or copy the text version below.
Who to recruit and how many
Real users, split at random. Work out the required sample size with a calculator before you start, using your current rate and the smallest change that would matter. If the number is out of reach, do not run the test.
Step-by-step plan
Write one change and one primary metric.
Add one guardrail, a metric that must not get worse.
Set your pass signal and required sample size.
Split users randomly and consistently.
Check that the split is even before reading any results.
Run for at least one full business cycle, usually a week or more.
Decide only at the planned end.
Test plan
Field
Your answer
The change
Why we think it will work
Primary metric
Guardrail metric
Current rate
Smallest change that matters
Sample size needed per version
End date
What to measure
The primary metric for each version, with a confidence interval. The guardrail. The actual split of users.
Pass signal to set before you start
Specky's starting point: the change beats the original on your metric by the margin you set, with enough traffic to trust it. This is a starting point, not a benchmark. Write the margin and the sample size down first.
Results log
Version
Users
Conversions
Rate
Interval
Guardrail
Decision
How many users do you need for an A/B test?
It depends on your current conversion rate and the smallest change worth detecting, the minimum detectable effect. The smaller either is, the more traffic you need. Using the two-sided formula in Evan Miller's free calculator, at its standard 5% significance and 80% power, here is the sample needed per version:
Current conversion rate
To detect a 5% relative lift
10% relative lift
20% relative lift
2%
about 310,000
about 78,000
about 19,800
5%
about 120,000
about 30,200
about 7,700
12%
about 46,300
about 11,700
about 2,900
20%
about 25,300
about 6,300
about 1,600
Halving the effect you want to detect roughly quadruples the traffic, and low baseline rates need far more people than high ones.
To check without a calculator, use Evan Miller's rule of thumb: n = 16σ² / δ², where δ is the minimum effect and, for a conversion rate p, σ² = p(1 − p). At 12% and a lift to 13.2%: 16 × 0.12 × 0.88 ÷ 0.012² ≈ 11,700 per version.
Worked example: from sample size to end date
This example is illustrative; it matches the worked example below.
Current rate: 12% of visitors sign up.
Smallest change that matters: a 10% relative lift, from 12% to 13.2%.
Sample size: about 11,700 per version, so about 23,400 visitors in total.
Traffic: about 860 visitors a day reach the signup page.
Duration: 23,400 ÷ 860 ≈ 27 days. Round up to whole weeks: 4 weeks.
If the answer had been six months, do not run a smaller test and hope. Test a bigger change, pick a metric with a higher base rate, or use a method that needs less traffic.
How long should you run a split test?
Until you reach the planned sample size, and for at least one full business cycle, usually a week or more, because weekday and weekend users behave differently.
Why shouldn't you peek at results?
Dashboards show a p-value that assumes you look once, at the end. Every extra look is another chance for noise to cross the line. Evan Miller showed that testing after every observation and stopping at the first p < 0.05 gives a false positive rate of 26.1%, more than five times the 5% you think you have (Evan Miller, 2010).
If you must look early, tighten the bar: peek 10 times and you need a reported significance of 1.0% to keep a true 5% rate.
Why does a "significant" result still need checking?
Kohavi and colleagues spell out the maths. If one idea in three is truly a winner, the average they reported across Microsoft experiments, a significant result is a true positive about 89% of the time. If real breakthroughs are one in 500, that drops to 3.1%. Surprising results need a rerun.
What should you measure in a split test?
The primary metric for each version, with a confidence interval, not just a percentage.
One guardrail metric that must not get worse, such as paid conversion, refunds or page load time.
The actual split of users. If you planned 50/50 and got 52/48 on large numbers, something is broken. That is a sample ratio mismatch. Checking for it needs only the expected proportions and observed counts, and catches a wide variety of data problems (SRM checker by Lukas Vermeer and colleagues). Do not read results until it passes.
Guardrails on rare events need a lot of traffic: detecting a 10% drop in a 1.2% paid conversion rate takes roughly 130,000 users per version. If you cannot reach that, write down in advance what counts as a breach, such as "any drop in paid customers blocks the launch".
Does this change cause more of the behaviour we want?
Does anyone take the next step for this offer?
Do existing users try to use a feature that isn't built yet?
Comparison
Control vs variant, at random
Usually one page against a target
One button against a target
Evidence
Causal, behavioural
Behavioural interest
Behavioural interest
Use a landing page or fake door test to learn whether there is interest at all; use a split test to learn which of two versions does better.
What does a split test look like in practice?
This example is made up to show the method. A team running a tax-filing tool wants to shorten its signup form from six fields to three. They predict signups will rise by at least 10% and set paid conversion as a guardrail.
After four weeks and 12,000 visitors in each group, the shorter form increases signups by 14%. But paid conversion falls, and the guardrail is breached: the extra signups are lower-intent people who never finish.
The signup goal passes and the guardrail fails, so they do not ship it as is. They try a shorter form with one extra question about the customer's filing type.
Here is how the log could read:
Version
Users
Signups
Rate
Paid customers
Decision
Six fields (control)
12,000
1,440
12.0%
144
Three fields
12,000
1,642
13.7%
131
Do not ship
The signup lift is real: +1.7 percentage points, with a 95% interval of about +0.8 to +2.5. The paid drop, from 144 to 131 customers, is too small to prove at this traffic, but the team's pre-written guardrail rule said fewer paying customers blocks the release.
What are the most common split testing mistakes?
Peeking. Checking early and stopping when it looks good produces false wins.
Changing several things. You will not know which one worked.
No guardrail. You can win a metric and lose the business.
Too little traffic. An underpowered test is just expensive noise.
Ignoring novelty. People click on new things just because they are new.
When it doesn't work: with low traffic, for big bets that cannot be split, for effects that take months, and where users talk to each other, so the groups are not independent.
Is it ethical to run a split test without telling users?
Ordinary changes, such as a shorter form or a new headline, are routinely tested without telling each user. The line is harm. Do not test anything you would not be comfortable shipping to everyone, do not show different prices to similar customers without a clear policy, and only count people your consent banner allows you to track.
How to run it in Specky
On the Assumptions page, click the note and choose Pick a test, then Split test. Specky fills in the steps, the pass signal, and a two-week timeline.
For a change inside your product, run the split with your own feature-flag or experiment tool. Specky does not change your product. It reads the numbers from connected analytics, and you attach the result as evidence.
If you are testing a Specky validation page, the split can happen there. Set up one control and up to five variants in Experiment analytics, and Specky shows conversion per version, 95% intervals, whether you have enough people, and an optional guardrail. The verdict stays cautious while the sample is small.
Click Start running, and record the result at the planned end.
A pass shows on the board as Supported, because a controlled comparison of what people did is behavior.
What should you do with each outcome?
Supported: Ship the change. Note the size of the win and check the analytics again in a month to see if the effect lasts.
Unclear: The result is within the margin of error. Keep the simpler version, or go and learn why with a few interviews.
Contradicted: The change had no effect, or made things worse. Do not ship it. Any bet resting on this note now shows as Contradicted.
Frequently asked questions
How much traffic do you need for a split test?
It depends on your current conversion rate and the smallest change that would matter. At a 12% conversion rate, detecting a 10% relative lift takes about 11,700 users per version at standard settings; at 2%, about 78,000. If you cannot reach the number in a reasonable time, use a different method.
Why shouldn't you stop a split test early?
Stopping when the results look good makes false wins far more likely, since results swing around early on. In Evan Miller's worst case, testing after every visitor gives a 26.1% false positive rate instead of 5%. Decide your end date and sample size in advance.
What is a guardrail metric?
A guardrail metric is a number that must not get worse during a test, even if your main metric improves, such as paid conversion, refunds or page speed. It stops you from winning a metric while hurting the business. Write the rule for what counts as a breach before the test starts.
What is the difference between a split test and an A/B test?
None in practice. Both show a change to a random share of users and compare one metric against a control group; researchers call it an online controlled experiment. Testing several changes in combination is a multivariate test, which needs much more traffic.