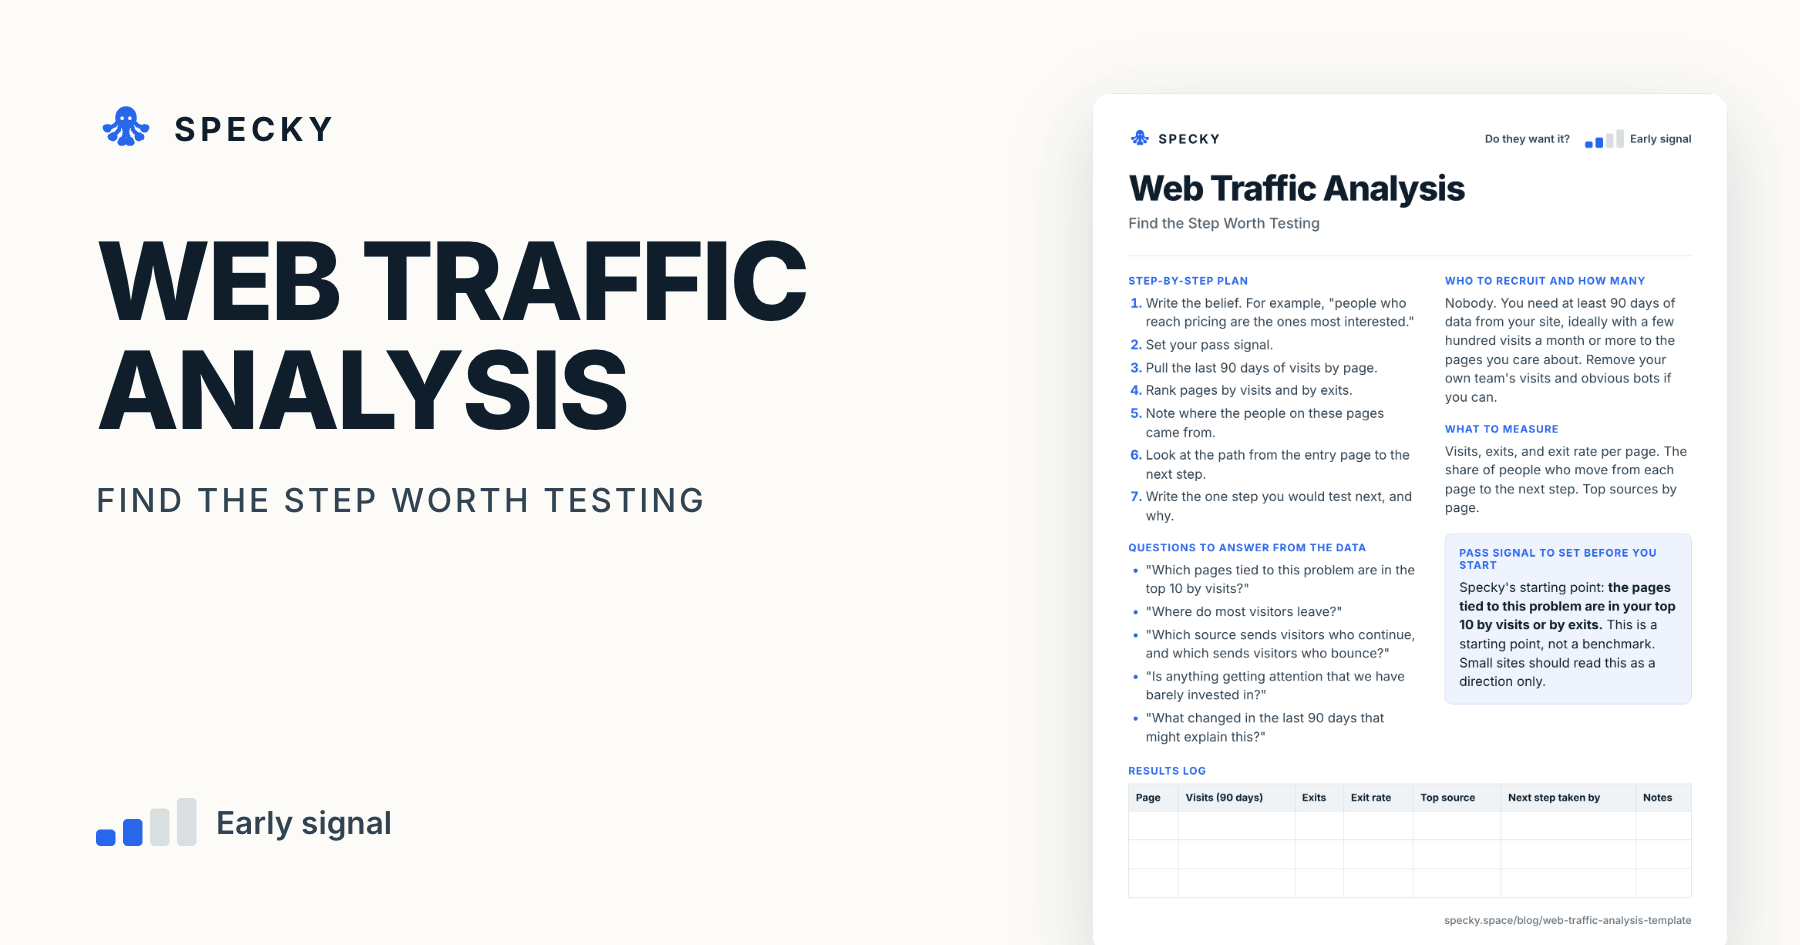
Web Traffic Analysis Template: Find the Step Worth Testing
Your traffic already shows where people arrive and where they leave. Read it properly, find the biggest gap, and stop arguing about which step to test.
Share
Web traffic analysis is a one-day desk test: you read the last 90 days of visits to your site to see which pages people open, where they came from and where they leave, then choose the one step most worth testing next. It uses data you already collect, needs no recruiting, and shows what visitors did, never why.
Key takeaways
It is one of five "data analysis" discovery experiments in David J. Bland and Alex Osterwalder's Testing Business Ideas (UPV course).
In Google Analytics 4, a session is engaged if it lasts longer than 10 seconds, has a key event or has 2 or more page views; bounce rate is the share of sessions that were not (Google Analytics Help).
A web traffic gap analysis compares the traffic you get with a reference (a target, an earlier period or a competitor). The biggest gap is usually the step worth testing.
Competitor numbers are estimates. Across 86 sites, Similarweb reported 19.4% fewer visits than Google Analytics (PLOS ONE, 2022). Use them to rank, not to count.
What is web traffic analysis?
Web traffic analysis reads the visits your site already recorded to answer three questions: which pages draw attention, where people come from, and where they stop.
The method comes from Testing Business Ideas (2019), which sorts 44 experiment types by setup time, run time, evidence strength and cost (Strategyzer). The output is not a traffic report but a decision: which single page or step deserves your next real test.
When should you use web traffic analysis, and when not?
Use it when you already have a site with steady visits and you want to stop guessing where the problem is. It takes about a day, and it often kills a theory before anyone gets attached.
Which risk does it test, and how strong is the evidence?
This tests desirability: are people showing interest in this part of the offer? The evidence is directional. It is real behaviour from real visitors, but you read it after the fact, with nothing changed and no comparison group. It points to a place worth testing, as our guide to choosing a product experiment explains.
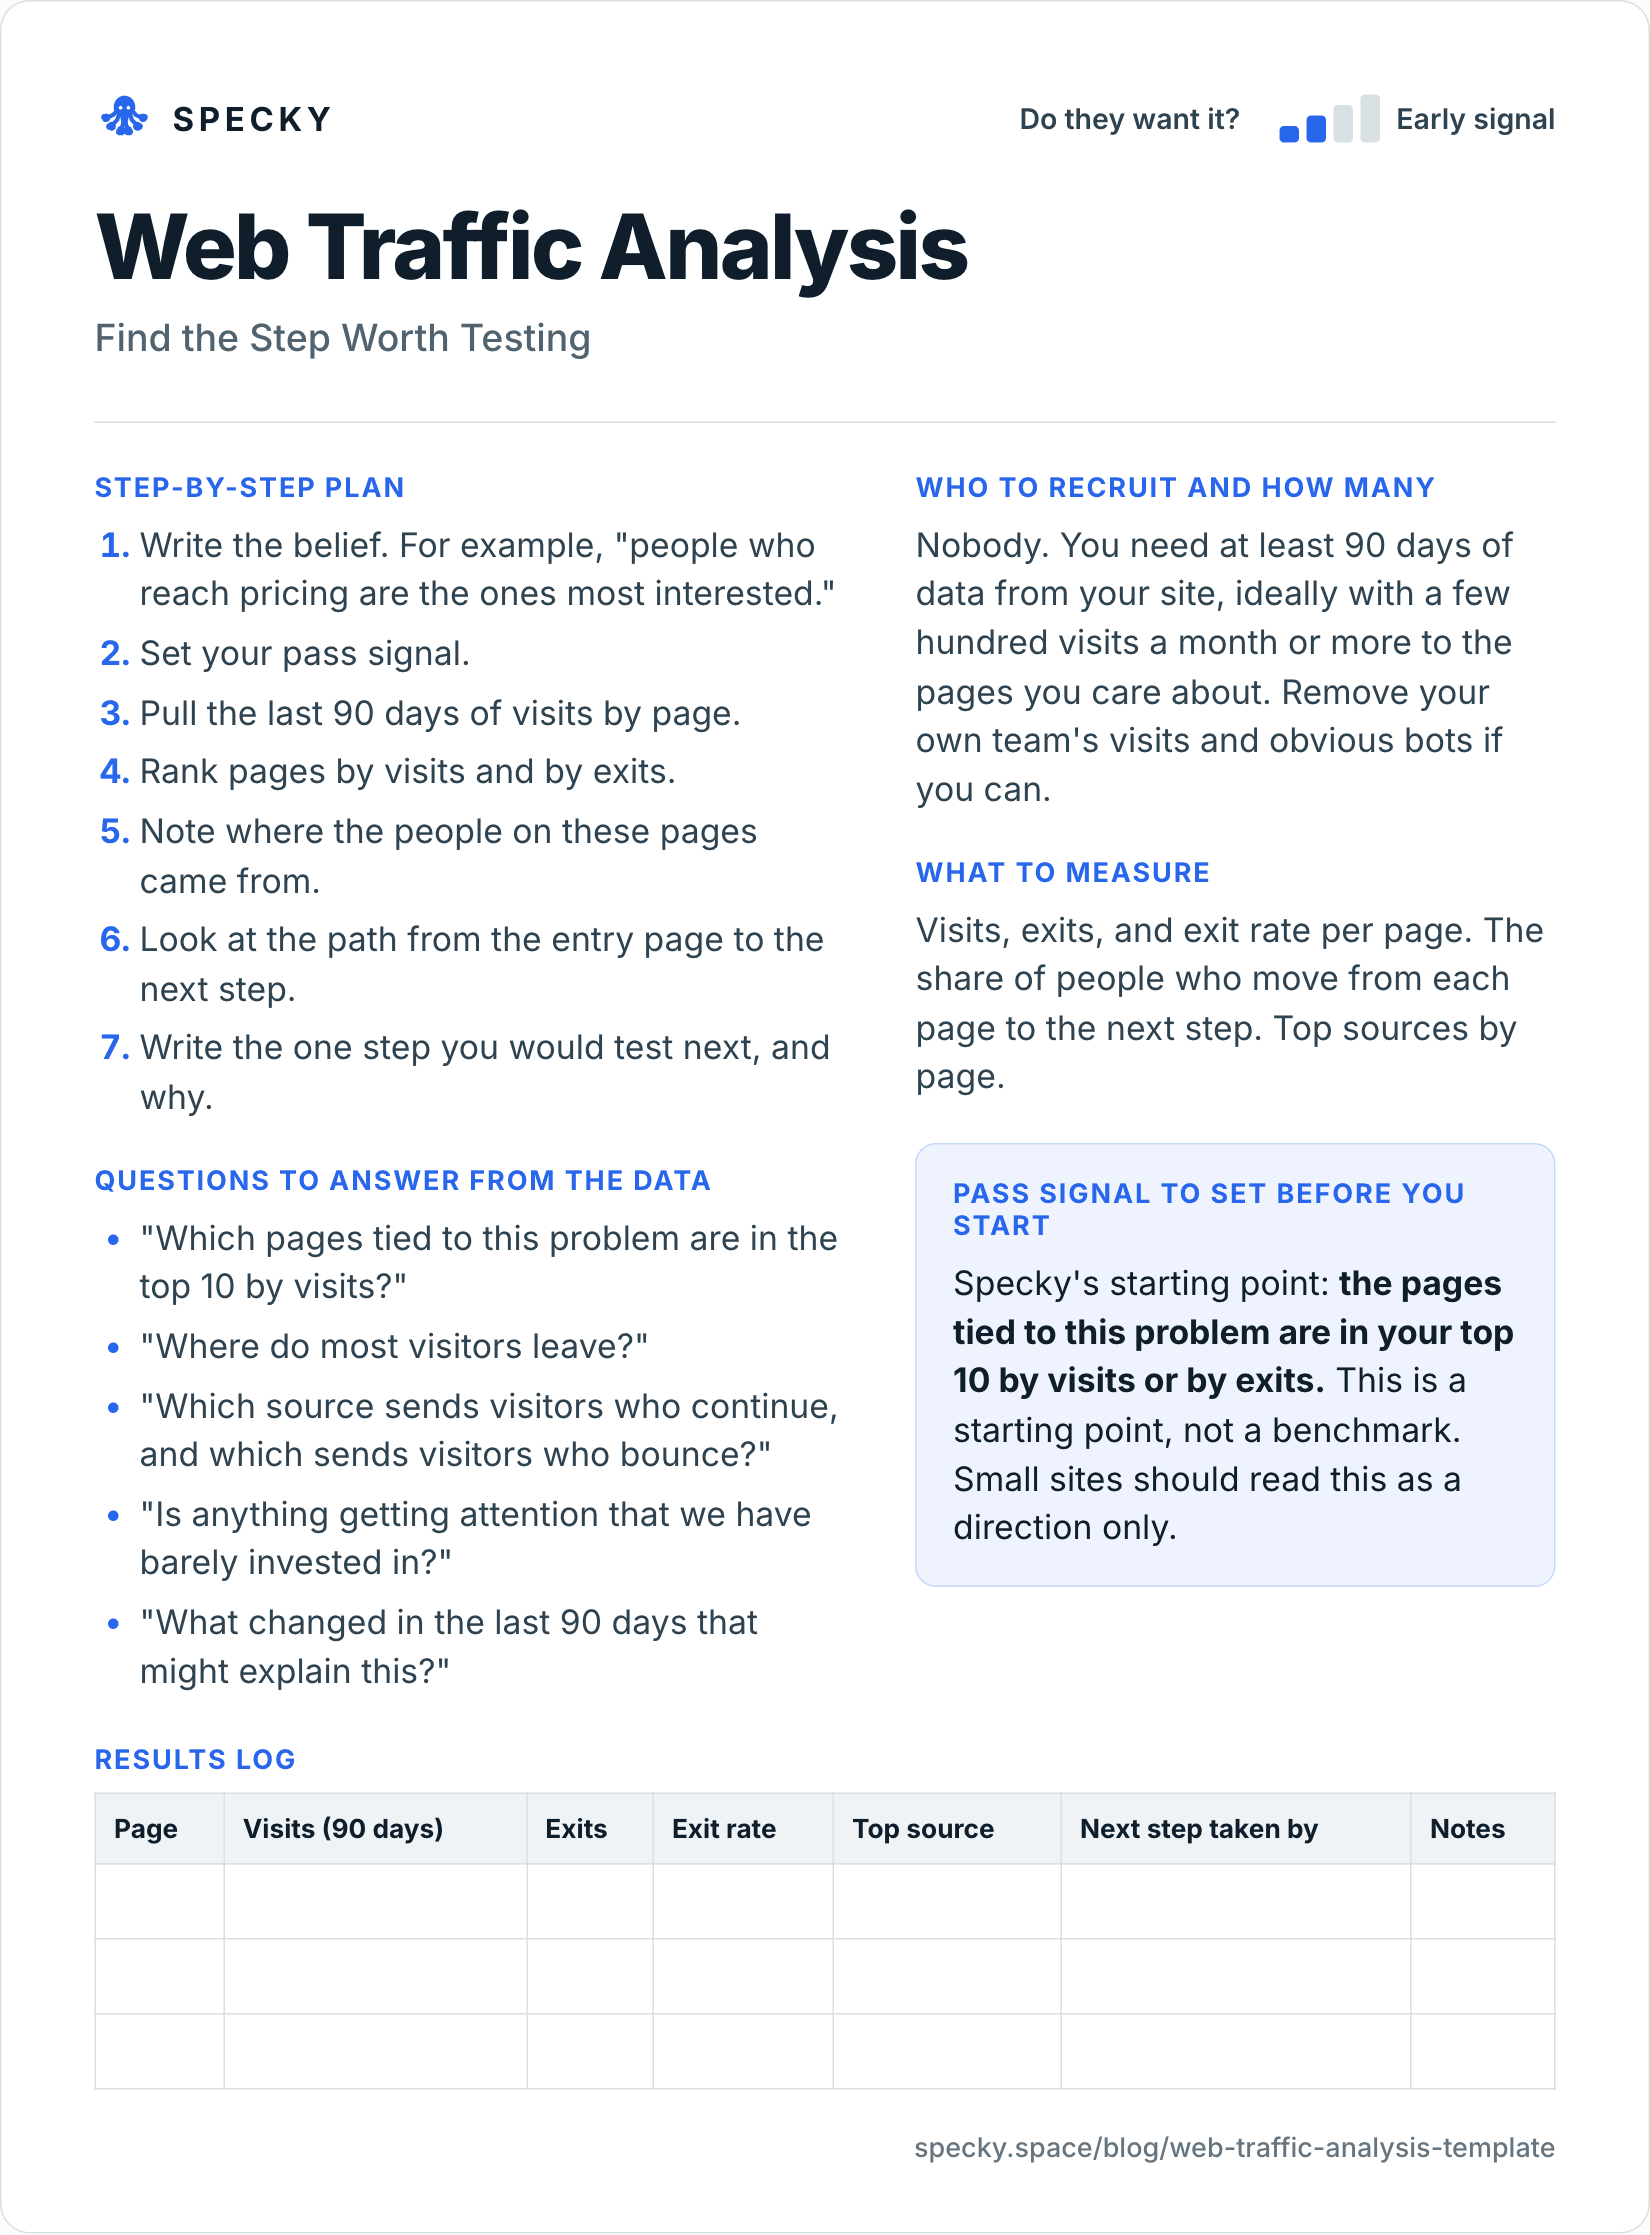
Copy-and-use web traffic analysis template
Open the image at full size, or copy the text version below.
Who to recruit and how many
Nobody. You need at least 90 days of data from your site, ideally with a few hundred visits a month or more to the pages you care about. Remove your own team's visits and obvious bots if you can.
Step-by-step plan
Write the belief. For example, "people who reach pricing are the ones most interested."
Set your pass signal.
Pull the last 90 days of visits by page.
Rank pages by visits and by exits.
Note where the people on these pages came from.
Look at the path from the entry page to the next step.
Write the one step you would test next, and why.
Questions to answer from the data
"Which pages tied to this problem are in the top 10 by visits?"
"Where do most visitors leave?"
"Which source sends visitors who continue, and which sends visitors who bounce?"
"Is anything getting attention that we have barely invested in?"
"What changed in the last 90 days that might explain this?"
What to measure
Visits, exits, and exit rate per page. The share of people who move from each page to the next step. Top sources by page.
Pass signal to set before you start
Specky's starting point: the pages tied to this problem are in your top 10 by visits or by exits. This is a starting point, not a benchmark. Small sites should read this as a direction only.
Results log
Page
Visits (90 days)
Exits
Exit rate
Top source
Next step taken by
Notes
What is a web traffic gap analysis?
A web traffic gap analysis lines up the traffic you get against a reference you wrote down first, and lists where the shortfall is biggest. The reference can be a target ("30% of pricing visitors should start a trial"), the same period last year, or one named competitor. Pick the version that matches your belief:
Gap type
What you compare
Data source
Question it answers
Step gap
Share moving from one page to the next, against your target
Your analytics (path or funnel report)
Where does the flow break?
Attention gap
Pages that get visits against pages you invested in
Your analytics, ranked by visits and exits
Is something popular that we barely support?
Search gap
Queries where you appear but get few clicks
Google Search Console, Keyword Planner
What are people looking for that we don't serve?
Competitor gap
Your traffic mix by channel against a rival's
Similarweb, Semrush (estimates)
Which channel do they win that we don't?
How to run one:
Write the reference before you look.
Pull both sides for the same 90 days, country and device split.
Compute each gap in people, not only in percentage points. A 20-point gap on a page with 50 visits matters less than a 5-point gap on a page with 5,000.
Rule out plain explanations: a seasonal dip, a broken link, a campaign that ended.
Write the one gap you will test and the change you would make there.
For the search gap, Search Console's Performance report shows clicks, impressions, click-through rate and average position by query and page, defaulting to the past three months (Search Console Help). Many impressions with few clicks means people see the page but don't choose it. Keyword Planner estimates monthly searches for phrases you don't rank for yet, but needs billing details in Google Ads and hides very low-volume keywords (Google Ads Help).
How accurate are Similarweb and Semrush traffic estimates?
Good enough to rank sites and compare channels; not good enough to count visits.
Similarweb blends four sources: analytics shared by site owners, its products installed on millions of devices, partner data from firms such as ISPs, and public data (Similarweb). Its own advice is to "focus on relative trends rather than exact numbers" (Similarweb blog).
Semrush models traffic from a panel of over 200 million anonymised users in more than 190 countries, built with hundreds of clickstream providers (Semrush Knowledge Base). It warns that its two traffic tools will almost always show different numbers, and tells owners to use Google Analytics for their own site (Semrush Knowledge Base).
Independent tests:
PLOS ONE (2022). Across 86 websites in 26 countries, Similarweb showed 19.4% fewer visits, 38.7% fewer unique visitors and a 25.2% higher bounce rate than Google Analytics. It underestimated 66 sites (76.7%) and came within about 5% for only 5 (5.8%). But rankings correlated strongly and the differences were systematic (PLOS ONE, 2022).
SparkToro (2022). Across 641 sites and 7,692 site-months, correlation with GA users was 0.790 for Semrush, 0.720 for Datos, 0.659 for Similarweb and 0.504 for Ahrefs, which only estimates organic search. Errors were "often +/-100% or more", and Similarweb was weakest for sites under 5,000 monthly visitors (SparkToro, 2022).
The rule: compare a competitor with yourself inside the same tool, never a Similarweb estimate with your own GA count. Because the error is systematic, look up your own site in the tool, note how far off it is, and apply that correction to rivals as a rough guide.
How do you read exits and bounces without fooling yourself?
An exit is the last page of a visit. A bounce, in GA4, is a session of 10 seconds or less with no key event and one page view. A help article with a high exit rate may be doing its job; a pricing page probably isn't. Then clean the data:
Bots. GA4 drops known bots automatically, using the IAB's International Spiders and Bots List, and won't show how much it removed (Google Analytics Help).
Your team. Mark internal traffic by IP address, with up to 10 data filters per property. An active filter drops data permanently, so test it first (Google Analytics Help).
Retention. Standard properties keep event-level data for 2 or 14 months, and the limit applies to explorations and funnel reports, not standard reports (Google Analytics Help). At 2 months, a 90-day path exploration silently misses a month.
Worked example (hypothetical)
This example is made up to show the method. A team selling a hiring tool believes its "integrations" page is what convinces people. They pull 90 days of data.
The integrations page is 14th by visits. But a help article on "how to write a job post without bias" is 3rd by visits, and nearly every visitor leaves from it. Almost none reach the product pages.
The pass signal fails for integrations. The real finding is that a lot of people come for job-post help and are given nowhere to go. The team's next test is a small offer on that page.
The invented numbers: 18,000 sessions in the window. The integrations page had 420 sessions and ranked 19th by exits, missing the top 10 on both counts. The help article had 3,100 sessions, a 90% exit rate and 82% of visitors from organic search. Only 1.5% went on to a product page, against 9% across the rest of the blog. That 7.5-point gap is about 230 people a quarter, the largest on the site.
Web traffic analysis vs product analytics check vs search trend analysis
A sensible order: search trends for the words, traffic for the page where interest breaks, then a product analytics check once people are inside.
What are the most common web traffic analysis mistakes?
Reading too short a window. A week can reflect one newsletter or one holiday.
Treating an exit as failure. Someone leaving after finding their answer got what they came for.
Ignoring where people came from. Search visitors and email visitors behave very differently.
Counting your own visits. On a small site, your team can be a big share.
Drawing conclusions about why. Traffic shows what. Ask people to learn why.
Mixing tools. A competitor's estimate against your own GA count compares a model with a measurement.
How to run it in Specky
On the Assumptions page, click the note and choose Pick a test, then Web traffic analysis. Specky fills in the steps, the pass signal, and a one-day timeline.
Specky reads the numbers from your connected analytics, such as PostHog, Mixpanel, Amplitude, or Pendo. There is no one-click button on this test: ask for the numbers in chat, or pull them from your tool, then attach them as evidence.
If your traffic data lives in a tool that is not connected, paste the numbers in with the source and date.
Click Start running, then record the result.
A pass shows on the board as Early signal, not Supported, because reading past traffic is directional.
What to do with each outcome
Supported (shows as Early signal): You have found the page or step that matters. Test a change there with a split test, or a new offer with a fake door.
Unclear: The numbers are too small or too mixed. Run an analytics check over a longer period, or watch a few visitors try the page.
Contradicted: People are not coming to or staying on this part. Find out what they are coming for instead. Any bet resting on this note now shows as Contradicted.
Frequently asked questions
What can web traffic analysis tell a product team?
It shows which pages attract visitors, where they came from and where they leave. That is enough to choose the most useful step to test next, and often to kill a favourite theory. It cannot explain why people behave as they do, so pair it with interviews or a usability test before redesigning.
What is the difference between exit rate and bounce rate?
Exit rate is the share of a page's views that were the last in a visit. Bounce rate in GA4 is the share of sessions that were not engaged: 10 seconds or less, no key event and one page view. A page can have a high exit rate and a low bounce rate when people read it, then leave satisfied.
How much traffic do you need?
Use at least 90 days of data, and be cautious if the pages you care about get fewer than a few hundred visits a month. With small numbers, a handful of visits can move a rate by ten points or more, so read the result as a direction and confirm it with a stronger test.
How accurate is Similarweb for small websites?
Not very. In SparkToro's 2022 comparison of 641 sites, Similarweb was the weakest of four providers for sites under 5,000 monthly visitors, and error ranges for every tool were often 100% or more. Compare sites inside one tool, and check your own site there first to see how far off it runs.
Can you do a web traffic gap analysis without paid tools?
Yes. Your own analytics covers step and attention gaps, Google Search Console covers search gaps for your site, and Keyword Planner gives rough volumes inside a Google Ads account. You only need Similarweb or Semrush for competitor gaps, and their numbers are estimates best compared within the same tool.