Search Trend Analysis Template: Check Demand Before You Build
Before you spend a month building, spend a day finding out whether anyone already searches for a way to solve the problem, and in which words.
Share
Search trend analysis is a one-day desk test that compares how often people search for your problem over the past 12 months, and in which words, against one similar term. It costs nothing, needs no recruiting, and tells you whether interest is growing, flat or fading. It cannot tell you who searched or whether they would pay, so treat the result as a clue, not proof.
Key takeaways
Google Trends never shows search counts. Every line is indexed from 0 to 100 against the highest point for the place and time you chose, and a 0 means "too little data", not "nobody" (Google Trends Help).
For a rough monthly volume you need a keyword tool. Google Keyword Planner shows ranges such as "100–1K" to lower-spending advertisers, a policy in place since 2016 (Search Engine Journal, 2016).
Volume figures are estimates. In a 2021 study of 72,635 keywords, 54% of Keyword Planner volumes were overestimates against real Search Console impressions (Ahrefs, 2021).
Search trends test desirability and the evidence is directional: real behaviour, but anonymous and at a distance.
Write your pass signal, including the volume that would matter to you, before you open any tool.
What is search trend analysis?
Search trend analysis reads public search data to answer two questions: is interest in this problem rising, flat or falling, and what words do people use when they look for help? You compare your main phrase against one comparison term of similar scope, so a general rise in searching isn't mistaken for your problem growing.
It is one of the cheapest experiments in David J. Bland and Alex Osterwalder's Testing Business Ideas (2019), a library of 44 experiment types split into discovery and validation (Strategyzer). Bland describes using Google Trends or Google Keyword Planner to gauge interest, and Osterwalder's advice is to start with weak, cheap evidence like this and move to stronger evidence for the same hypothesis (InfoQ, 2020).
Search data is more than a marketing toy. Google's own economists, Hyunyoung Choi and Hal Varian, showed in 2009 that Trends data could help estimate the current level of car sales, home sales, retail sales and travel (). That is the right frame for product work too: search tells you about the present, not the future.
When should you use search trend analysis, and when not?
Use it early, when you want a one-day read on whether a problem is growing, flat or fading, and to learn the words people really use. It costs nothing and asks nothing of anyone.
Do not use it:
For a problem people don't know they have. No one searches for that.
For very new categories and tiny niches. Volume is too low to read, and Google Trends shows low-volume terms as 0.
To find out who will act. A rising line is not a customer. To see who will click on an offer, run an online ad test.
For most B2B products with a handful of buyers. Fifty target companies won't move a search index. Talk to them instead.
Which risk does it test, and how strong is the evidence?
This tests desirability: are people already looking for a way to solve this? The evidence is directional. A trend is real behaviour, but anonymous and at a distance. You cannot tell who searched or why. Our guide to choosing a product experiment treats this as a clue that tells you where to spend a stronger test.
Copy-and-use template
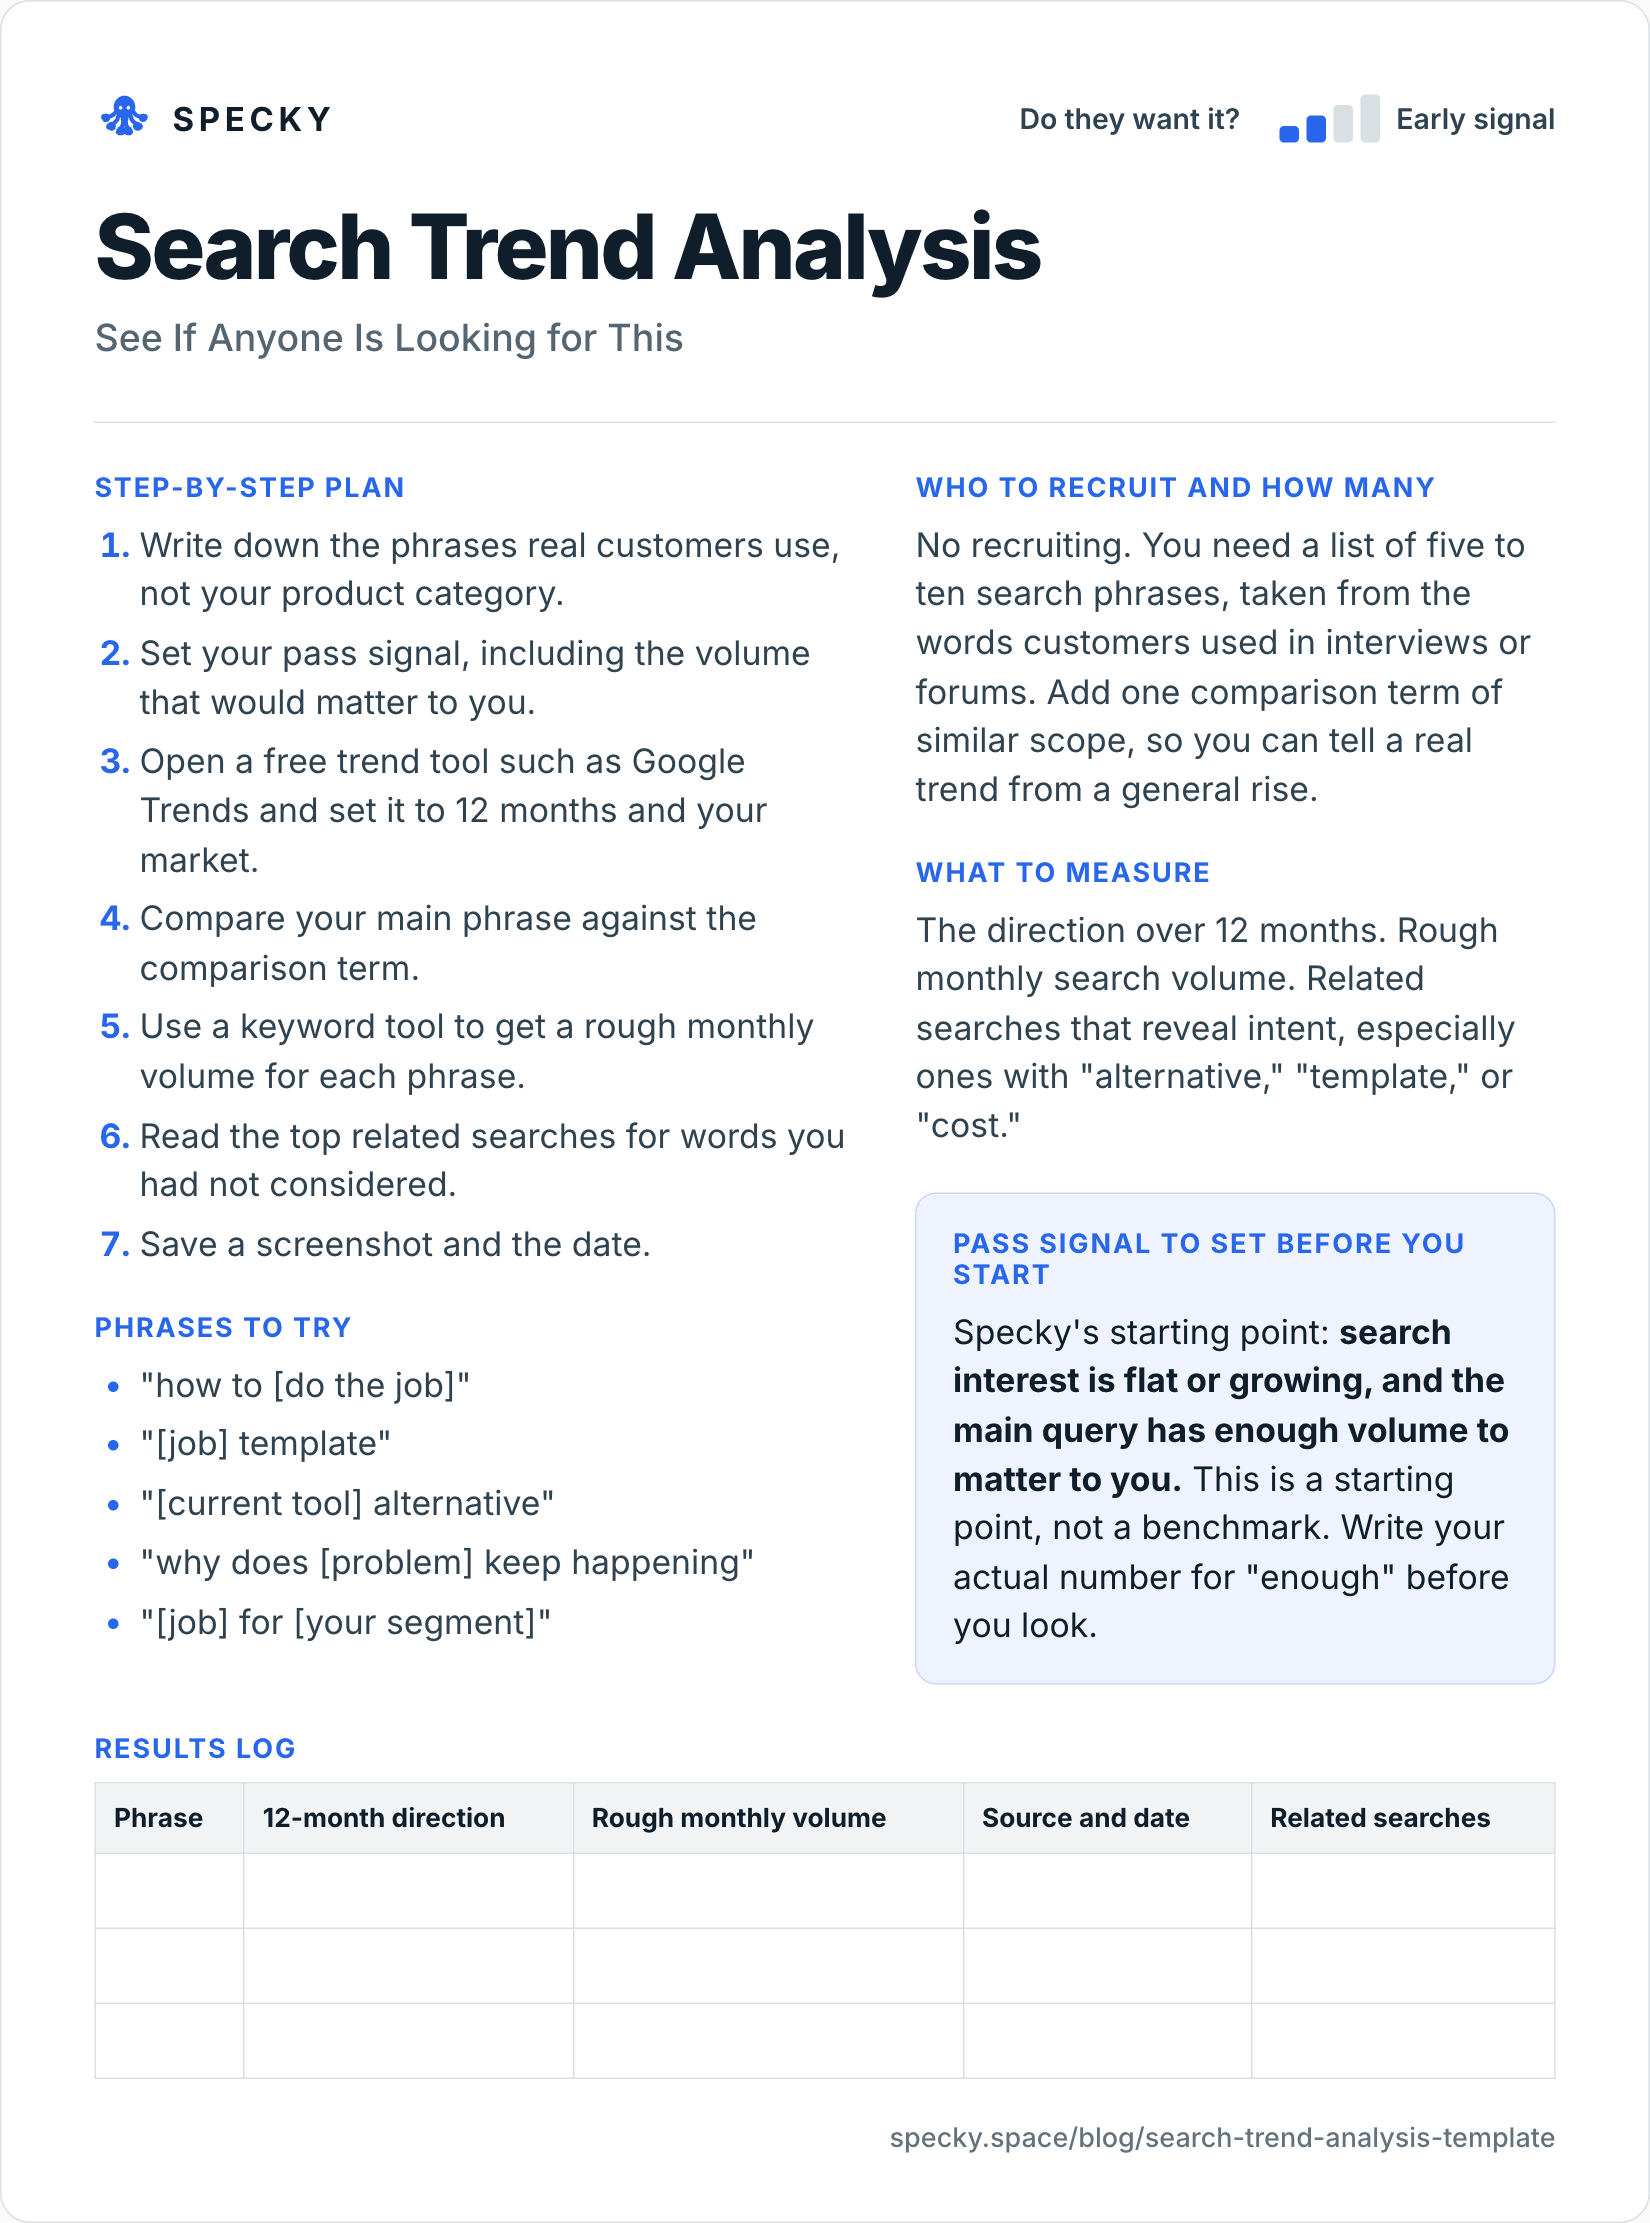
Open the image at full size, or copy the text version below.
Who to recruit and how many
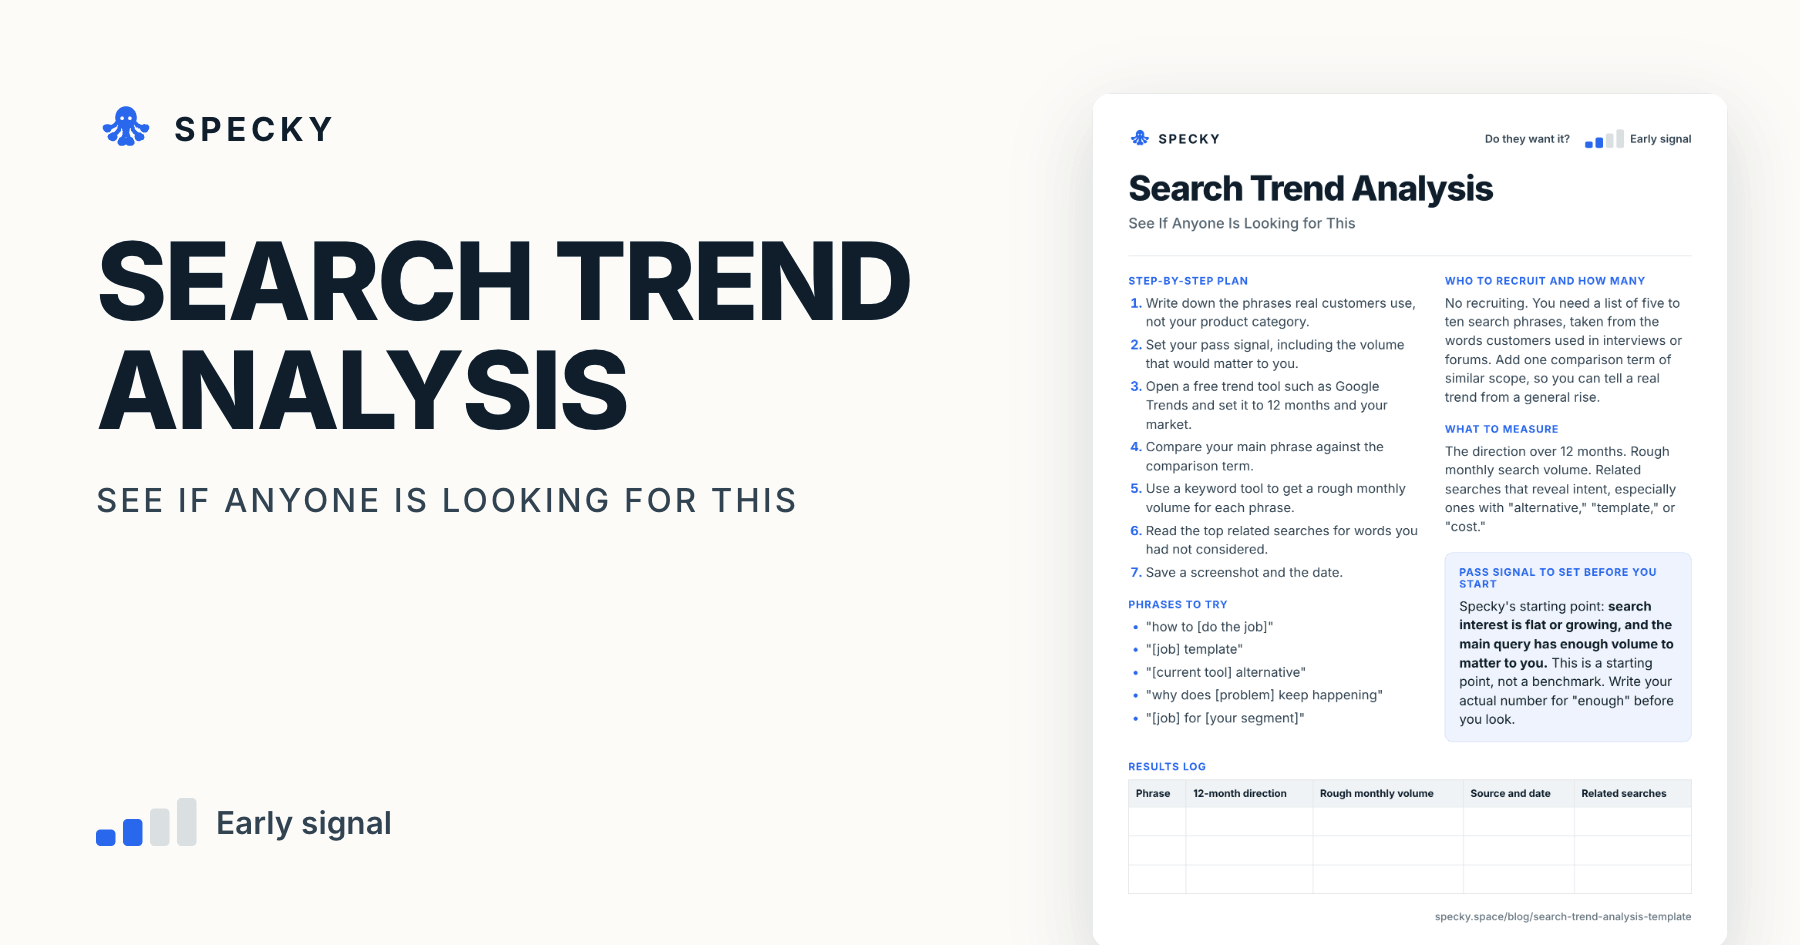
No recruiting. You need a list of five to ten search phrases, taken from the words customers used in interviews or forums. Add one comparison term of similar scope, so you can tell a real trend from a general rise.
Step-by-step plan
Write down the phrases real customers use, not your product category.
Set your pass signal, including the volume that would matter to you.
Open a free trend tool such as Google Trends and set it to 12 months and your market.
Compare your main phrase against the comparison term.
Use a keyword tool to get a rough monthly volume for each phrase.
Read the top related searches for words you had not considered.
Save a screenshot and the date.
Phrases to try
"how to [do the job]"
"[job] template"
"[current tool] alternative"
"why does [problem] keep happening"
"[job] for [your segment]"
What to measure
The direction over 12 months. Rough monthly search volume. Related searches that reveal intent, especially ones with "alternative," "template," or "cost."
Pass signal to set before you start
Specky's starting point: search interest is flat or growing, and the main query has enough volume to matter to you. This is a starting point, not a benchmark. Write your actual number for "enough" before you look.
Results log
Phrase
12-month direction
Rough monthly volume
Source and date
Related searches
How do you read Google Trends without fooling yourself?
Google Trends is the default free tool, and most mistakes come from reading it like a counter. Five facts from Google's own help pages change how you read the chart:
It is a share, not a count. Each point is divided by all searches in that place and time, then scaled so 100 is the peak (Google Trends Help). A line can rise while total searches for your phrase stay flat, if overall searching in that region fell.
0 means "not enough data". Trends only shows popular terms. Low-volume terms appear as 0, which does not mean no one searched.
Small spikes may be noise. Google adds statistical noise to protect privacy, most visible for low-interest queries, and says one-off spikes there should not be read as real activity.
It is a sample, cleaned. Repeat searches by the same person over a short period are removed, queries with apostrophes and other special characters are filtered out, and searches inside Google's AI Mode and AI Overviews are excluded.
Search terms are literal. A search term won't match misspellings, synonyms, or singular and plural forms; put a phrase in quotes for an exact match (Google Trends Help). Topics group the exact phrase with misspellings and acronyms across all languages, and Google's training team calls them generally more reliable (Google News Initiative).
Two practical rules follow. Compare like with like: topics against topics, search terms against search terms. And compare everything you care about in one chart, because each chart is scaled to its own peak, so a "60" in one chart and a "60" in another are not the same amount. Google's help page says the current Explore view compares up to 8 groups of terms with up to 50 terms in each (classic Explore: 5 groups of up to 25).
Google Trends vs Keyword Planner: which numbers should you trust?
You need both tools, because they answer different questions. Trends shows direction and seasonality; a keyword tool gives a rough monthly volume.
Google Trends
Google Keyword Planner
Paid SEO tools (Semrush, Ahrefs)
What it shows
Relative interest, 0–100
Estimated average monthly searches
Modelled monthly volume plus history
Absolute numbers?
No
Yes, but often as ranges
Yes, as estimates
Cost
Free
Free inside a Google Ads account
Paid subscription
Main limit
Low-volume terms show as 0
Lower-spend accounts see buckets: 0, 1–100, 100–1K, 1K–10K and up
Estimates differ between tools
Best for
Direction, seasons, related queries
Order of magnitude
Comparing many phrases fast
Keyword Planner sits inside Google Ads and asks you to finish account setup, including billing, and it can't show keywords with very low volumes (Google Ads Help). Since August 2016, advertisers with lower monthly spend may see only a range: a keyword with 500 searches a month shows as "100–1K" (Search Engine Journal, 2016).
Even exact-looking figures are estimates. Ahrefs compared 72,635 keywords against Google Search Console impressions for pages ranking at the top: 54.28% of Keyword Planner volumes were overestimates and 45.22% roughly accurate, while its own tool was roughly accurate about 60% of the time (Ahrefs, 2021). Ahrefs sells a competing tool, so read that as a vendor study. The lesson holds either way: use volume for order of magnitude (tens, hundreds, thousands), never as a precise count.
Who offers search trend analysis for new product planning?
Four kinds of provider, from cheapest to most expensive:
Free tools you run yourself. Google Trends for direction and Google Keyword Planner for volume. For most early product decisions this is enough, and the template above is built for it.
SEO and keyword platforms. Semrush, Ahrefs and similar tools show modelled volume, history and related questions for many phrases at once. Useful when you have 50+ phrases to check.
Trend-discovery services. Tools such as Exploding Topics and Glimpse sit on top of search data and flag fast-growing terms. They help you find candidate topics; they don't tell you whether your specific problem matters.
Market research agencies. They combine search data with surveys and panels. Worth it when a wrong call would cost far more than the fee.
Whichever you use, the method doesn't change: customer words in, one comparison term, a 12-month window, a pass signal set in advance. A trend report without a pre-set threshold is a mood board.
Search trend analysis vs forum research vs an online ad test
These three are often confused. They sit at different points on the evidence ladder.
A sensible order: trends for the words, forums for the pain, then an ad for intent. If you need market size rather than direction, use online market research instead.
Worked example (hypothetical)
This example is made up to show the method. A founder wants to build software for planning community garden plots. She decides beforehand that "enough" means at least 500 searches a month across her phrases.
The trend line for "community garden software" is flat, but volume is too small to show. "Allotment waiting list" is steadier and shows a yearly spring peak. Her phrases add up to about 300 searches a month in her market.
Direction passes, but volume does not. She records it as inconclusive and learns something useful: people search around waiting lists, not garden planning.
Two details make her log trustworthy. Her Keyword Planner account shows ranges, so she records the 300 as "sum of range midpoints, order of magnitude only". And because the spring peak repeats each year, she notes that a three-month window starting in March would have shown a false "rising" trend. Her next step is a forum research pass on waiting-list complaints, to hear whether the pain is the wait or the paperwork.
What are the most common search trend analysis mistakes?
Using your own words. Search the words customers say, or you will measure nothing.
Reading one spike as a trend. Check the full year for seasons and news events.
Skipping a comparison. Without one, a general rise looks like a win.
Looking before deciding what counts. Set "enough" first.
Mistaking searching for buying. Search shows curiosity. It does not show anyone will pay.
Comparing numbers across charts. Each Trends chart is scaled to its own peak; only lines in the same chart compare.
Treating 0 as zero demand. In Trends it means the volume is below the display threshold.
How to run it in Specky
On the Assumptions page, click the note and choose Pick a test, then Search trend analysis. Specky fills in the steps, the pass signal, and a one-day timeline.
Pull the numbers from a free trend tool. Specky's label for this method says it reads connected analytics, but product analytics tools do not hold public search volume, so this part is on you.
Click Start running, then attach the numbers, the source, and the date to the test as evidence, and record the result.
A pass shows on the board as Early signal, not Supported, because a search trend is directional.
What to do with each outcome
Supported (shows as Early signal): People are looking. See if they will click on your offer with an online ad.
Unclear: Volume is low or seasonal. Try the problem's other names, or read forum threads to see how people describe it.
Contradicted: Interest is falling fast, or nobody searches. That may mean a shrinking market, or a problem people do not look up. Interview before you decide, using a customer interview template. Any bet resting on this note now shows as Contradicted.
Frequently asked questions
Can search trends validate a product idea?
No. Search trends can suggest interest, but they cannot validate a product idea. They show that people are looking, not that they will buy, and they can't tell you who searched. Treat a rising trend as a reason to run a stronger test, such as an online ad or a landing page with a real next step, and record the trend as directional evidence.
How do you check search demand for free?
Use Google Trends to compare your phrases over 12 months in your market, using the exact words customers use and one comparison term in the same chart. Then use Google Keyword Planner, free inside a Google Ads account, for a rough monthly volume. Expect ranges such as 100–1K if your account spends little, and treat them as orders of magnitude.
Does Google Trends show search volume?
No. Google Trends shows relative interest on a 0–100 scale, where 100 is the peak for the place and time you selected. Values are a share of all searches, based on a sample, so they never equal a count. For an estimated monthly number, use a keyword tool and accept that even those figures are modelled.
How much search volume is enough to build a product?
There is no universal number; it depends on your price and how many customers you need. Work backwards. Say you need 100 paying customers and assume about 1% of searchers to become customers over a year, then you need roughly 10,000 relevant searches in that year. Write your number down before you look, as in the worked example above.
What if nobody searches for my problem?
No searches can mean no demand, or it can mean people do not realise a solution exists. Run a few interviews before you decide, since search cannot detect a problem people do not name. New categories often start with zero search volume and grow later, so low volume alone shouldn't kill an idea that interviews support.