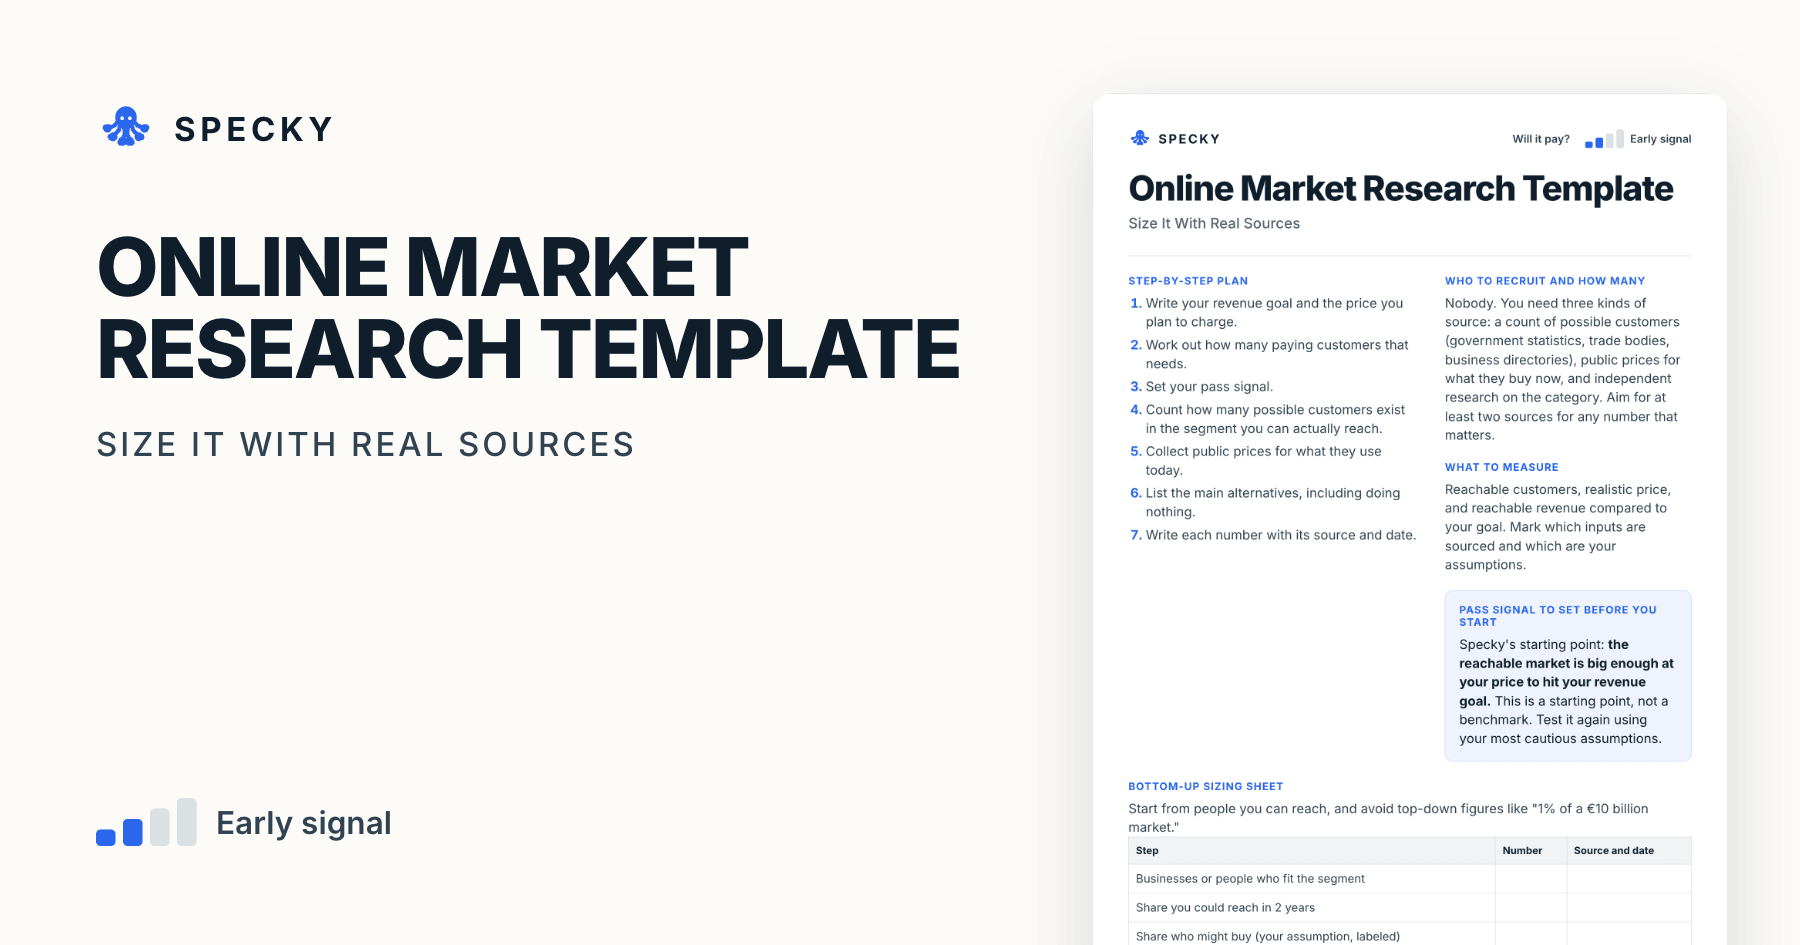
Online Market Research Template: Size a Market Bottom-Up
Skip the "we only need 1%" maths. Count the customers you can really reach, multiply by a price they already pay, and keep a source and date next to every number.
Share
Online market research is a desk test that checks whether a market is big enough to reach your revenue goal at the price you plan to charge. You count the customers you can really reach from public sources, multiply by a price they already pay, and keep a source and date next to every figure. It takes a few days and can stop an idea that could never pay for itself.
Key takeaways
Build the number bottom-up. When Pear VC surveyed 30 investors, the most consistent feedback was to stop presenting revenue as a percentage share of a large market (Pear VC, 2021).
Free official counts exist. Eurostat counts 34 million active enterprises in the EU for 2024, and 94.4% of them employ fewer than 10 people (Eurostat). Most of any "1% of businesses" are tiny.
A big market is not demand. Of 385 VC-backed shutdowns with known causes since 2023, 43% cited poor product-market fit and 19% unsustainable unit economics (CB Insights, 2026).
The pass signal: the reachable market is big enough at your price to hit your revenue goal, even on cautious assumptions.
What is online market research?
Online market research means pulling public numbers on market size, pricing and competitors, and keeping each source and date next to the figure. In product discovery it answers one question: could this be big enough to reach your revenue goal, at the price you can charge?
It is desk research, not a survey: nobody is recruited. The output is a one-page sizing sheet where every number is either sourced and dated, or labelled as your assumption so someone can challenge it.
When should you use online market research, and when not?
Use it to answer the "is the money there?" question before you spend months on an idea. It takes a few days, and it can stop an idea that could never pay for itself.
Do not use it:
To find out whether customers want your product. A big market says nothing about your product.
In very new categories, where public numbers are mostly guesses.
To learn what buyers will pay. For that, try a pricing survey.
Which risk does it test, and how strong is the evidence?
This tests viability: is the money there? The evidence is directional. Public figures describe a market in general, and they say nothing about whether your particular offer will win any of it. Our guide to choosing a product experiment treats it as a sanity check.
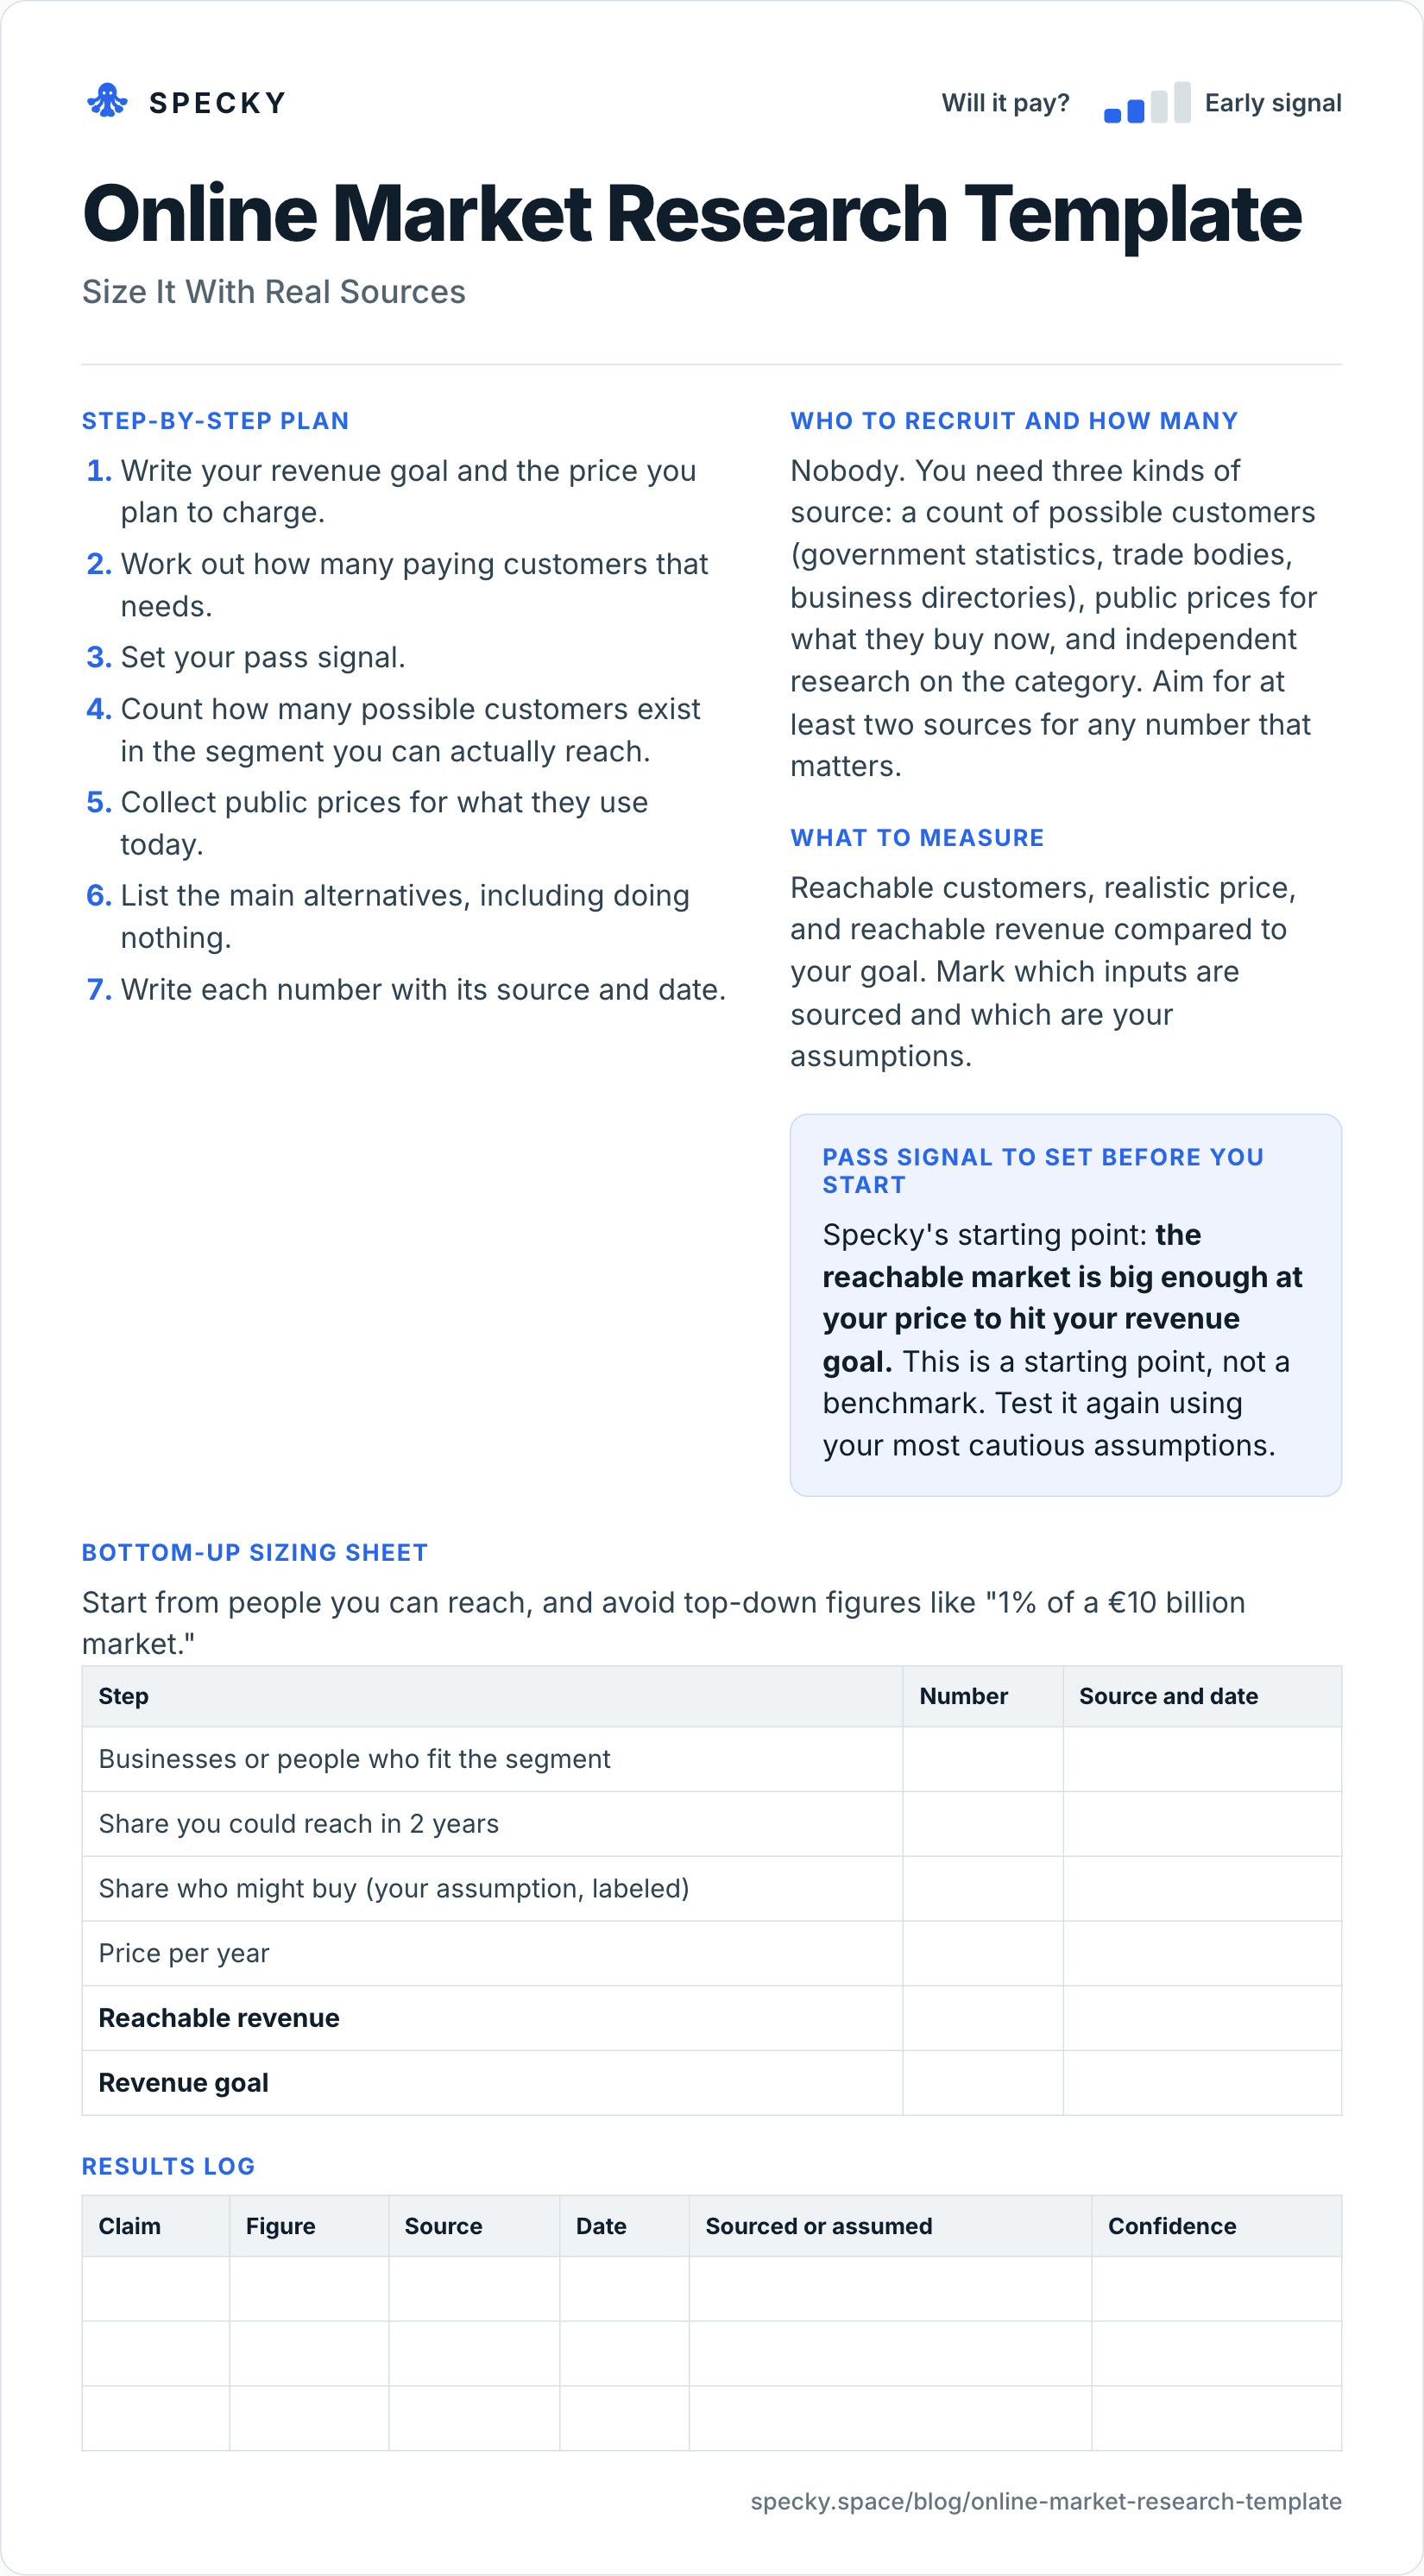
Copy-and-use online market research template
Open the image at full size, or copy the text version below.
Who to recruit and how many
Nobody. You need three kinds of source: a count of possible customers (government statistics, trade bodies, business directories), public prices for what they buy now, and independent research on the category. Aim for at least two sources for any number that matters.
Step-by-step plan
Write your revenue goal and the price you plan to charge.
Work out how many paying customers that needs.
Set your pass signal.
Count how many possible customers exist in the segment you can actually reach.
Collect public prices for what they use today.
List the main alternatives, including doing nothing.
Write each number with its source and date.
Bottom-up sizing sheet
Start from people you can reach, and avoid top-down figures like "1% of a €10 billion market."
Step
Number
Source and date
Businesses or people who fit the segment
Share you could reach in 2 years
Share who might buy (your assumption, labelled)
Price per year
Reachable revenue
Revenue goal
What to measure
Reachable customers, realistic price, and reachable revenue compared to your goal. Mark which inputs are sourced and which are your assumptions.
Pass signal to set before you start
Specky's starting point: the reachable market is big enough at your price to hit your revenue goal. This is a starting point, not a benchmark. Test it again using your most cautious assumptions.
Results log
Claim
Figure
Source
Date
Sourced or assumed
Confidence
How do you size a market bottom-up?
Bottom-up market sizing starts from a count of real possible customers and multiplies by what each would pay a year. Top-down sizing starts from a big industry figure and narrows it. The Canadian innovation hub MaRS describes both and recommends checking one against the other (MaRS):
TAM (total addressable market): revenue if you won 100% of the market for your product.
SAM (serviceable addressable market): the part you can realistically target and serve.
SOM (serviceable obtainable market): the part of SAM you can realistically capture with your resources and position.
Pear VC's guide puts the bottom-up method in one line: number of customers × average revenue per customer per year. Investors prefer it because each input can be tested, and Pear suggests using a top-down figure only to sanity-check the order of magnitude (Pear VC, 2021).
The template's sheet is a SOM calculation. Work it in this order:
Goal ÷ price = customers needed. €500,000 ÷ €1,200 a year = 417 customers.
Count the segment from an official or directory source, and write the definition you used.
Apply a reach share you can defend from a named channel (a trade body list, a marketplace, a community), not a hope.
Apply a buy share and label it as an assumption.
Compare reachable customers with customers needed. If you need more than half the segment, the plan is fragile.
Rerun with cautious inputs. If it only passes on optimistic ones, the buy share is your next assumption to test.
Estimated monthly searches as a rough demand signal
Needs billing details; very low-volume keywords aren't shown
The Census Bureau notes that private businesses use County Business Patterns to analyse market potential (US Census Bureau). And Keyword Planner shows lower-spending advertisers ranges rather than numbers, so a phrase with 500 searches a month appears as "100–1K", a policy in place since 2016 (Search Engine Journal, 2016). Record it as a range.
Why do top-down market numbers mislead?
Three reasons, each with a fix.
The percentage is invented. "We only need 1%" sounds modest, but the share is usually an afterthought with nothing behind it, which is why Pear's surveyed investors pushed back on it. Fix: replace the share with a count of customers you can name a route to.
The headline market is the wrong market. Report headlines define markets broadly. The EU has 34 million enterprises, but 94.4% are micro businesses (Eurostat), and many will never buy software at your price. Fix: filter by size band and sector before you count.
History can understate a new market. In 2014, NYU professor Aswath Damodaran valued Uber at $5.9 billion, using a $100 billion historical taxi market and a 10% maximum share. Uber investor Bill Gurley argued both assumptions could be off by a factor of 25, because a cheaper, better service grows the market itself (Bill Gurley, 2014). Fix: when your product changes price or convenience a lot, treat past market size as a floor and test demand directly.
Worked example (hypothetical)
This example is made up to show the method. A founder wants to sell scheduling software to independent opticians in Austria at €1,200 a year. Her goal is €500,000 in yearly revenue within three years, or about 417 customers.
She finds a trade body count of opticians and estimates, from public listings, about 800 independent shops. To hit her goal she would need more than half of them. Even her optimistic guess was one in five.
Her pass signal fails at this price in this country. She does not give up the idea. She notes that the sum works if she adds Germany, and writes that as the next assumption to test.
Her filled-in sheet, with the invented numbers:
Step
Optimistic
Cautious
Independent shops, Austria
800
800
Share reachable in 2 years
100%
60%
Share who might buy (assumed)
20%
10%
Customers
160
48
Reachable revenue at €1,200
€192,000
€57,600
Goal
€500,000
€500,000
Adding Germany, where she pencils in 4,000 independent shops as an assumption to check, gives 4,800 shops. Optimistic: 960 customers and €1,152,000, a pass. Cautious: 288 customers and €345,600, still short. So her next test is the buy share, with a pricing survey and a few interviews, not more desk research.
Online market research vs search trend analysis vs pricing survey
Run online market research first to see whether the sum can work, search trends to learn the words, then a pricing survey to replace your assumed price with a measured range. If the sum fails, check the whole business model on a Lean Canvas before changing the segment.
What are the most common online market research mistakes?
Starting from a huge market number. "We only need 1%" is how fantasy spreadsheets begin.
Leaving out the date. A market figure from five years ago may be very wrong.
Quoting a report's headline. Reports often define the market far more broadly than your segment.
Hiding your guesses. Mark each assumption so someone can challenge it.
Forgetting that "nothing" is a competitor. Many customers solve this with a spreadsheet, for free.
Using a count that leaves people out. Establishment counts with paid employees miss sole traders, who may be your best buyers.
How to run it in Specky
On the Assumptions page, click the note and choose Pick a test, then Online market research. Specky fills in the steps, the pass signal, and a three-day timeline.
You run this one. Specky keeps the plan and the result. Fill in the sizing sheet, then paste the numbers, sources, and dates onto the test.
Specky also has a separate Market research workflow that can gather public sources. Treat what it finds as a starting list, and open each source yourself before you rely on it.
Click Start running, then record the result.
A pass shows on the board as Early signal, not Supported, because public numbers are directional.
What to do with each outcome
Supported (shows as Early signal): The sum works. Now find out whether people will pay your price with a pricing survey, then a funnel test to learn what a customer costs to reach.
Unclear: Your sources disagree. Look for a better count of customers, or ask an expert who knows the market.
Contradicted: The market is too small at this price. Change the segment, the price, or the goal. Any bet resting on this note now shows as Contradicted.
Frequently asked questions
What is bottom-up market sizing?
Bottom-up market sizing starts with a count of real possible customers, then multiplies by how many you could reach and what they would pay each year. It is more honest than taking a percentage of a large market figure, because every input can be checked or tested. Use a top-down figure only to confirm you are in the right order of magnitude.
What is the difference between TAM, SAM and SOM?
TAM is the revenue if you won the whole market for your product. SAM is the part you can realistically target and serve. SOM is the part of SAM you can realistically win with your resources. For an early product decision, SOM is the number that matters, and it should be built from customer counts rather than a percentage of TAM.
Can market research validate a startup idea?
No. Online market research can show whether a market is large enough, but not whether customers want your specific product. Pair it with a test where people act, such as a pricing survey with a real next step, a landing page or a presale. Treat a passing result as permission to run that stronger test.
Where can I find free market data?
Government statistics (Eurostat in the EU, the US Census Bureau's County Business Patterns), national company registers, trade associations, public company reports and competitors' pricing pages are good free sources. Google Keyword Planner adds rough search volumes. Record where each number came from and when it was published.
How big does a market need to be?
Work backwards from your goal. Divide your revenue goal by your yearly price to get the customers you need, then compare that with the customers you can realistically reach. If you need more than about half of a reachable segment, the plan depends on an unusual share and needs a bigger segment, a higher price or a smaller goal.