Usability Test Template: Script, Tasks and a 5-User Plan
Every time you want to explain your product, you have found a bug. Five people, up to three tasks, and you say nothing until the end.
Share
A usability test template is a ready-made plan for watching real users try to finish tasks in your product while you stay silent. It gives you the tasks, a neutral script, what to measure and a results log, so five sessions of about 30 minutes show you where people get stuck. Below is a free template, the script, a pass signal and the evidence behind the five-user rule.
Key takeaways
Five users of one type find most problems. Jakob Nielsen's model found five participants uncover about 85% of usability problems, and he advises three rounds of five over one round of 15 (Nielsen Norman Group, 2000).
Five users find problems, not numbers to quote. For a completion rate or benchmark, Nielsen recommends at least 20 users (Nielsen Norman Group, 2012).
Across 1,189 tasks in 115 usability tests, the average task-completion rate was 78% (MeasuringU, 2011).
The 10-item System Usability Scale gives one comparable score after the tasks. Above 68 is above average.
Set the pass signal first: at least 4 of 5 people finish without help.
What is a usability test?
A usability test gives target users a task on the current version of your product and watches in silence to see where they get stuck.
Kate Moran of the Nielsen Norman Group breaks it into three parts: a facilitator who gives instructions without steering, realistic tasks, and a realistic participant who usually thinks out loud (NN/g, 2019).
Qualitative testing finds problems and is the common kind. Quantitative testing collects metrics such as task success and time on task, to set a benchmark. This template is qualitative and moderated: you watch live, in person or over screen share, so you can ask "What did you expect to happen?" at the end.
When should you run a usability test, and when not?
Use it when something is already built, and people are dropping out or asking for help. It is cheap, and the results tend to be obvious once you see them. NN/g estimates a simple study takes about 3 days, from planning through five sessions to analysis, with incentives costing a few hundred dollars.
Do not use it to find out whether people want the product. People will gamely try anything you put in front of them. Do not use it on a design that does not exist yet, either. A clickable prototype does that job, and a paper prototype is cheaper still. To watch people cope with a rival's product instead of yours, run a boomerang test.
Which risk does it test, and how strong is the evidence?
This tests desirability in the practical sense: can people actually use this to get the job done? The evidence is behaviour. It shows that the product works for people, but not that they value it. See our guide to choosing a product experiment for the bigger picture.
Usability test template (copy and use)
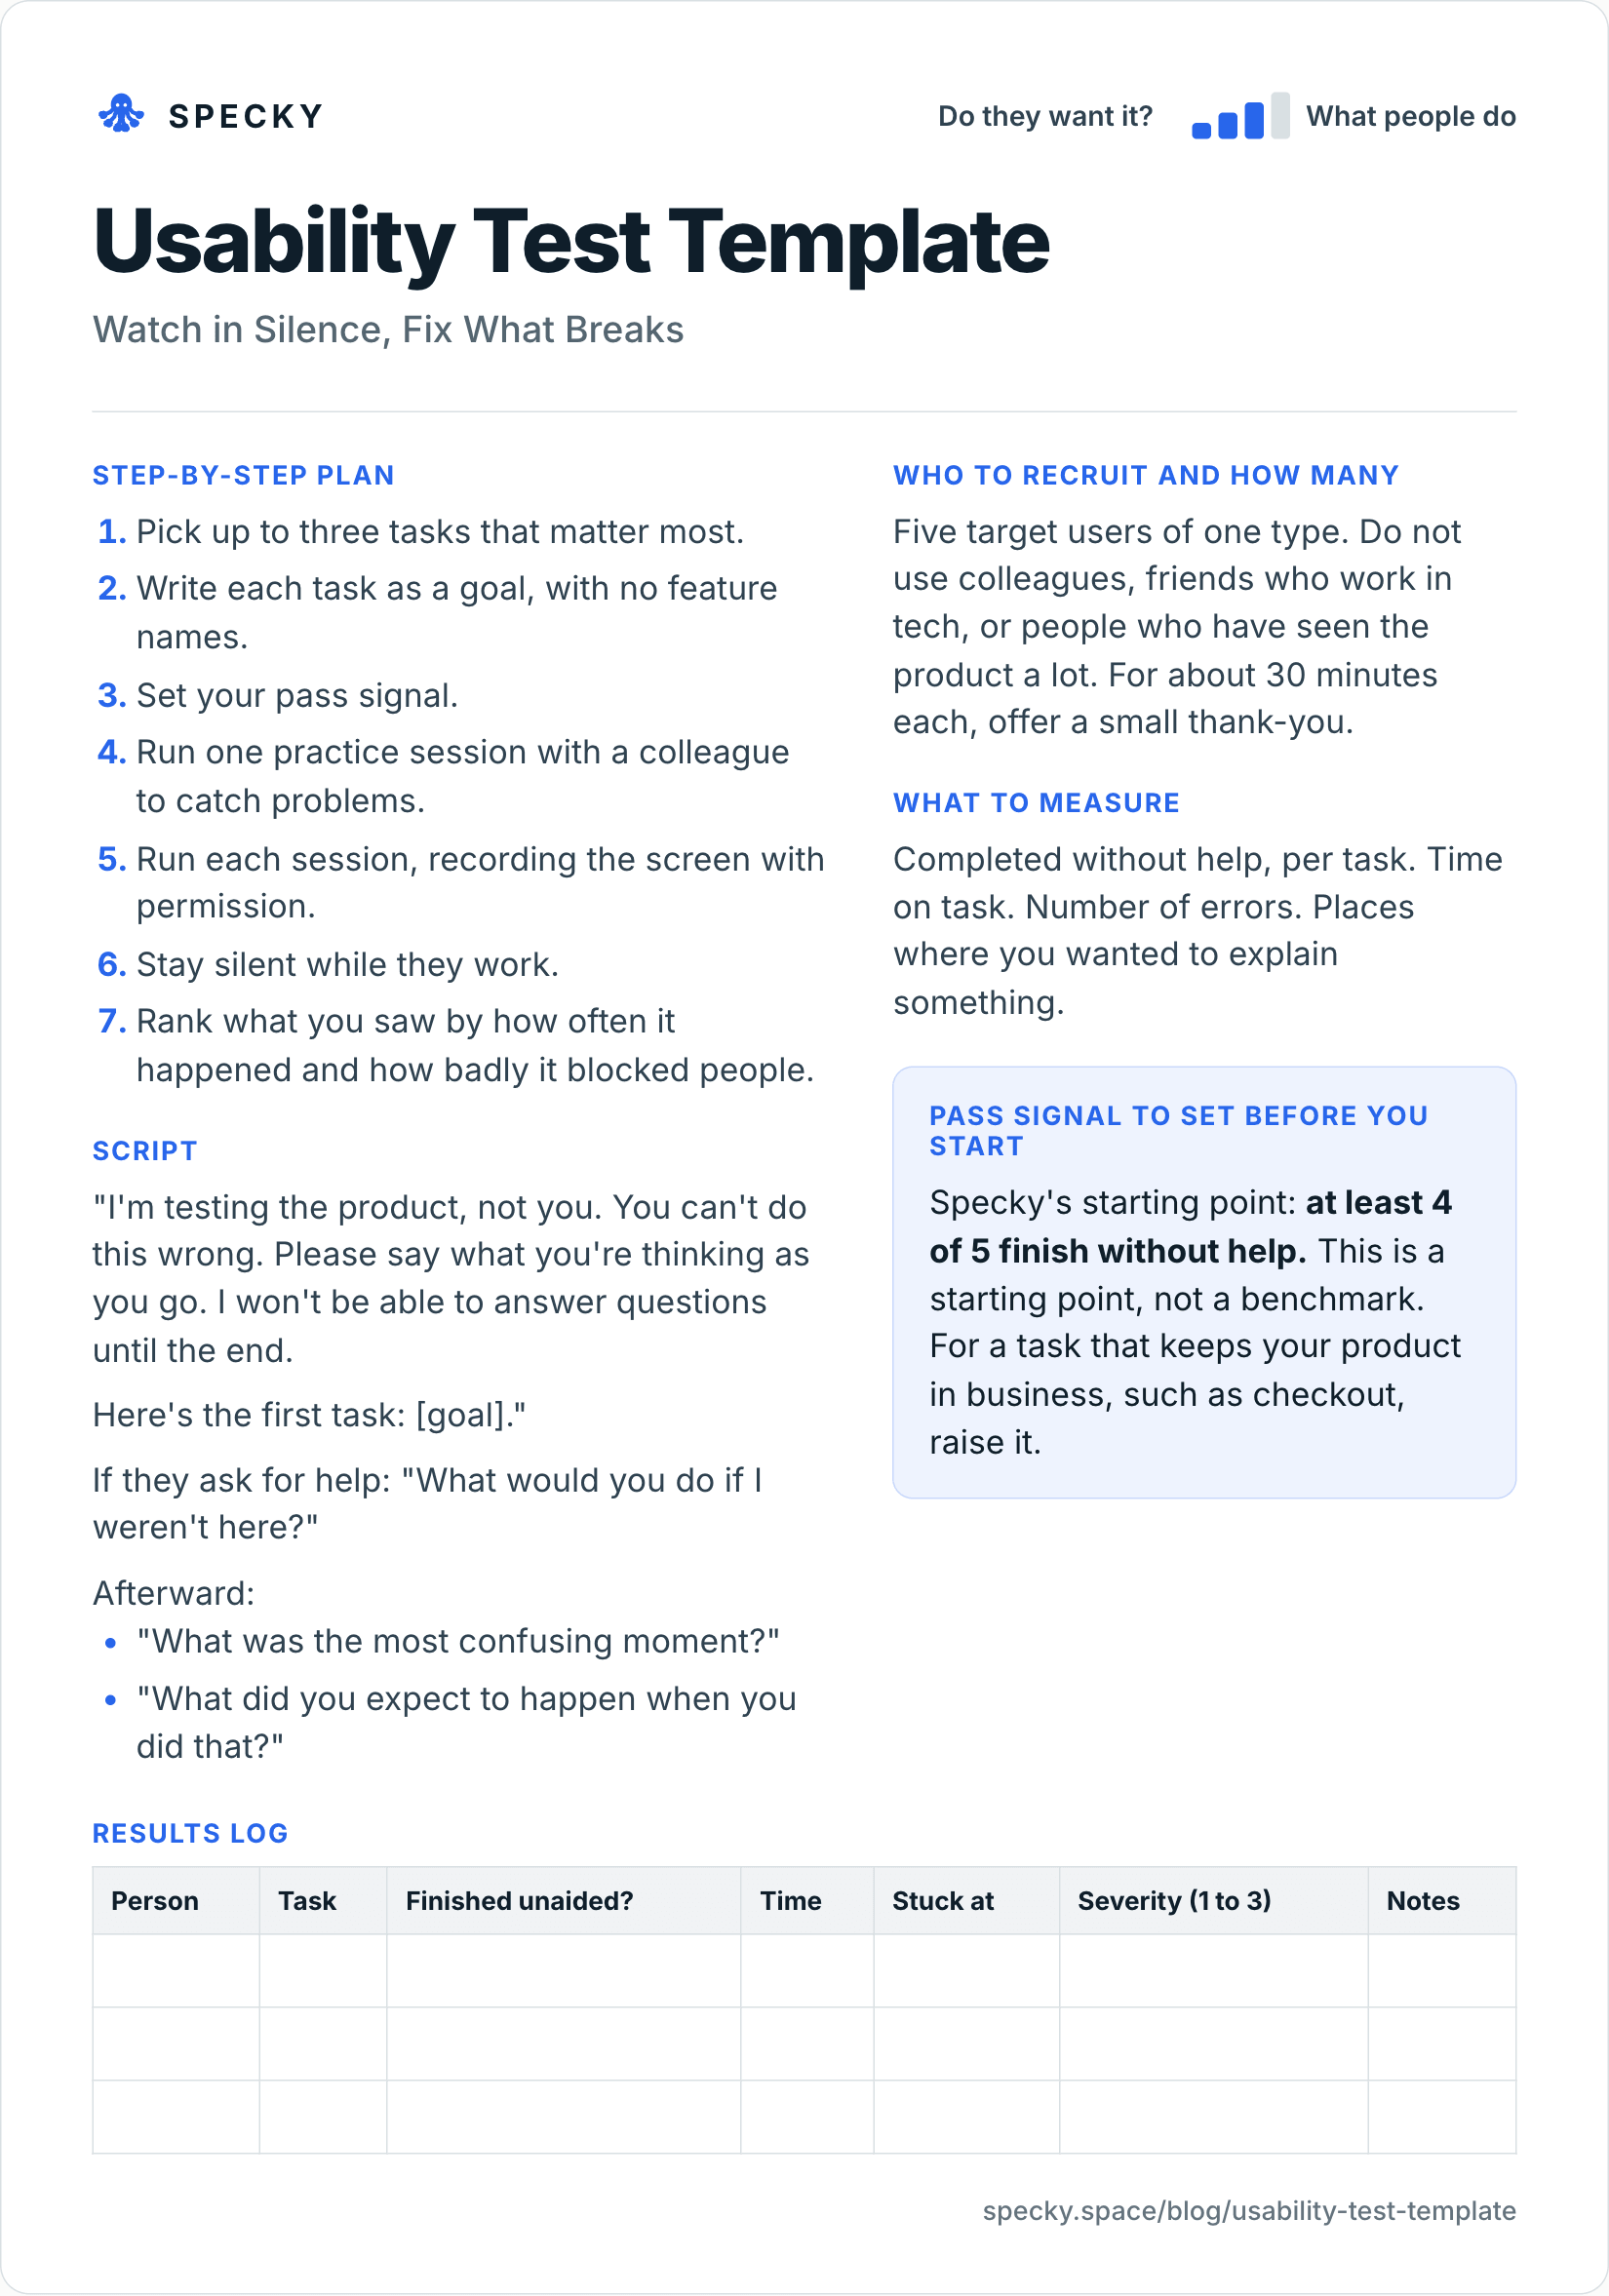
Open the image at full size, or copy the text version below.
Who to recruit and how many
Five target users of one type. Do not use colleagues, friends who work in tech, or people who have seen the product a lot. For about 30 minutes each, offer a small thank-you.
Step-by-step plan
Pick up to three tasks that matter most.
Write each task as a goal, with no feature names.
Set your pass signal.
Run one practice session with a colleague to catch problems.
Run each session, recording the screen with permission.
Stay silent while they work.
Rank what you saw by how often it happened and how badly it blocked people.
Script
"I'm testing the product, not you. You can't do this wrong. Please say what you're thinking as you go. I won't be able to answer questions until the end.
Here's the first task: [goal]."
If they ask for help: "What would you do if I weren't here?"
Afterwards:
"What was the most confusing moment?"
"What did you expect to happen when you did that?"
What to measure
Completed without help, per task. Time on task. Number of errors. Places where you wanted to explain something.
Pass signal to set before you start
Specky's starting point: at least 4 of 5 finish without help. This is a starting point, not a benchmark. For a task that keeps your product in business, such as checkout, raise it.
Results log
Person
Task
Finished unaided?
Time
Stuck at
Severity (1 to 3)
Notes
How do you write good usability test tasks?
A task is a goal the person already has, written in their words. If the task names your button, you are testing whether people can read.
Weak task
Better task
"Use the Import button to add guests."
"You have 40 guests in a spreadsheet. Get them into your guest list."
"Open Settings and change the invoice logo."
"Your invoices should show your new logo. Make that happen."
Decide what "done" means before the first session: "guests appear with names and emails" is a pass, "they found the import screen" is not. Give people realistic data, and print each task on a card so they can reread it without asking you.
How many users do you need for a usability test?
Five per round, of one type of user. Nielsen's model says the share of problems found with n users is 1 − (1 − L)ⁿ, where L is the share a single user finds. Across the projects he studied, L averaged 31% (Nielsen Norman Group, 2000).
That 31% is an average. A problem that trips only one person in ten is much easier to miss:
Users in the round
Problems found (L = 31%)
Chance of seeing a problem that affects 10% of users
1
31%
10%
3
67%
27%
5
84%
41%
10
98%
65%
15
99.6%
79%
That is why Nielsen recommends spending a 15-person budget on three rounds of five, fixing the design between rounds: rare problems surface over rounds.
Different user types need their own rounds. For two groups, Nielsen suggests 3 to 4 users each; for three or more groups, 3 each.
Numbers need more people. For statistically meaningful metrics, he recommends at least 20 users (NN/g, 2012). In the same article, a survey of 217 conference participants found teams averaged 11 participants per round.
Worked example: why five users can't give you a completion rate
This example is illustrative. Say 4 of 5 people finish your checkout task. That is "80% success", but the 95% confidence interval (adjusted Wald) runs from about 36% to 98%. The true rate could be poor or excellent.
Now say 16 of 20 finish. Same 80%, but the interval narrows to about 58% to 93%. Use five people to find and fix problems, and 20 or more when someone needs a percentage.
What should you measure in a usability test?
The template's four measures are enough for a qualitative round. Two additions make results easier to act on.
How do you rate the severity of a usability problem?
Nielsen rates severity on three factors: how often the problem occurs, how hard it is to get past, and whether it keeps bothering people (NN/g, 1994). His scale runs from 0 to 4; the template's 1-to-3 scale maps to his top three levels:
Template severity
Nielsen's level
What happened
What to do
1
2, minor
Slowed them down, they recovered
Fix when cheap
2
3, major
Needed several tries or a guess
Fix before the next round
3
4, catastrophe
Could not finish without help
Fix before release
Nielsen found one person's severity ratings too unreliable to trust and recommends averaging three evaluators. Rate separately, then compare.
Should you add the System Usability Scale?
The System Usability Scale (SUS) is a 10-item questionnaire with five answers from "Strongly agree" to "Strongly disagree". John Brooke created it in 1986, and usability.gov noted over 1,300 articles and publications referencing it (usability.gov, archived).
To score it, subtract 1 from each odd-numbered answer, subtract each even-numbered answer from 5, add the ten results and multiply by 2.5 (MeasuringU, 2011). Illustrative example: answers of 4, 2, 4, 1, 4, 2, 5, 2, 4, 2 give 16 from the odd items and 16 from the even items, so 32 × 2.5 = a SUS score of 80.
The score is not a percentage. The average across 500 studies is 68, and the top 10% score above 80.3. SUS is also not diagnostic: it says how usable something feels, not what to fix. With five people, read it as a rough signal and compare it round to round.
Usability test vs clickable prototype test vs customer interview
What problem do people have, and how do they solve it today?
Evidence
Behaviour on the real thing
Behaviour on a simulation
What people say about the past
Best moment
After launch, when people drop out or ask for help
Before you build
Before you design anything
Interviews find the problem, a prototype tests a solution before you build, and a usability test checks it once it is real.
What does a usability test look like in practice?
This example is made up to show the method. A team running a tool for wedding planners sees that many people start a guest list but do not finish. They watch five planners try to import 40 names from a spreadsheet.
Two finish. Three reach a screen titled "Map fields," stop, and go back. One says, "I don't know what you're asking me."
The signal fails. The team replaces that screen with a preview of the imported names, and tests with five more people the following week. Four finish. Nobody had to redesign the rest of the product.
In the log, three of five blocked at one screen makes "Map fields" a severity 3. A "Done" button below the fold slowed one person and went in as severity 1. Round one: 2 of 5. Round two: 4 of 5, which meets the pass signal. Ten 30-minute sessions, one screen changed.
What are the most common usability testing mistakes?
Helping. Each time you explain, you hide a real problem.
Naming the feature in the task. "Use the Import button" tests reading, not usability.
Testing with colleagues. They already know how it works.
Asking for opinions. Watch what they do.
Writing a report instead of a fix. Fix the top issue and test again.
Quoting percentages from five people. "80% success" from 4 of 5 has an interval from 36% to 98%.
When it doesn't work: for questions about demand or price, for rare problems that need dozens of sessions to show up, and for behaviour that only appears over weeks of real use.
How do you record usability sessions ethically?
A screen recording with a voice is personal data, so treat it that way. Tell people what you record, who will watch it and how long you keep it, and get a yes before you press record. Say they can stop at any point and still get the thank-you. Use test accounts and sample data, never their real customers or bank details. Share 30-second clips of the problem, not whole sessions, and delete raw files when the round is done.
How to run it in Specky
On the Assumptions page, click the note and choose Pick a test, then Usability test. Specky fills in five users, the pass signal, and a three-day timeline.
You run this one. Specky keeps the plan and the result. Hold the sessions and record them yourself, with permission.
Click Start running. Paste what happened in each session, and record the result.
A pass shows on the board as Supported, because watching someone finish a task is behavior.
What should you do with each outcome?
Supported: The flow works. Check that it holds up with real traffic with a product analytics check.
Unclear: Results differ by type of user. Split them, and run five of each.
Contradicted: People cannot complete it. Fix the worst problem first, and test again. Any bet resting on this note now shows as Contradicted, and it should stay that way until the retest.
Five users of one type is the standard starting point. Jakob Nielsen's model estimates five participants find about 85% of usability problems, as long as they are similar users. Test again with five more after each fix rather than running 15 at once. For two distinct user groups, test three or four of each, and use at least 20 for metrics you plan to quote.
What should you say during a usability test?
Say as little as possible. Read the task, ask people to think aloud, then stay quiet. If someone asks for help, reply "What would you do if I weren't here?" Your urge to explain marks a usability problem, so log it. Save questions such as "What did you expect to happen?" for the end.
What is the difference between a usability test and user research?
A usability test is one kind of user research. It checks whether people can use something that already exists, by watching them try tasks. Broader research, such as customer interviews, explores what people need and how they cope today, before anything is designed. Interviews find the problem; usability tests check the solution.
What is a good task completion rate?
Across 1,189 tasks in 115 usability tests, MeasuringU found an average completion rate of 78%, with the top quarter above 92% and the bottom quarter below 49%. For tasks where failure is costly, such as checkout, aim for 100%. With five users, count finishes rather than quoting a rate, because the margin of error is too wide.