Pricing Survey Template: Van Westendorp Questions and Analysis
Stop guessing what to charge. Four questions give you a range of prices people accept, ready to test with a real offer. Here is how to ask them and how to read the answers.
Share
A pricing survey asks people in your target segment what a product should cost before anyone pays. The standard version is the Van Westendorp Price Sensitivity Meter: four questions about the price at which your product feels too cheap, a bargain, expensive and too expensive. Plotted together, the answers give a range of acceptable prices to test with a real offer.
Key takeaways
Peter van Westendorp introduced the four-question method in 1976 (Wikipedia). Its acceptable range runs between two points where the answer curves cross (Conjointly). It gives you a range, not a price.
The Gabor-Granger method asks a yes-or-no question at fixed prices instead, and gives a rough demand curve. SurveyMonkey suggests five evenly spaced price points and at least 100 responses per segment (SurveyMonkey).
Stated prices are biased both ways: hypothetical valuations ran about 1.35 times real ones on the median across 28 studies (Murphy et al., 2005), yet Van Westendorp respondents tend to understate.
Specky's starting pass signal: your planned price sits inside the range at least half consider acceptable, from at least 50 responses.
What is a pricing survey?
The four-question format is the Van Westendorp Price Sensitivity Meter, introduced by Dutch economist Peter van Westendorp in 1976. Instead of asking "what would you pay?", it asks for four thresholds, so you learn where price starts to hurt and where it starts to look suspicious.
The "too cheap" question matters more than it looks. A low price can make people doubt quality, an idea with a long history in pricing research: André Gabor and Clive Granger's 1966 paper in Economica was titled "Price as an Indicator of Quality" (Gabor & Granger, 1966).
Which risk does it test, and how strong is the evidence?
This tests viability: is there a price range people accept that also works for you? The evidence is opinion. Nobody spends anything. The result is a range to test, as explained in our guide to choosing a product experiment.
When should you use a pricing survey, and when not?
Use it when you have no idea what to charge, or when your team is guessing between very different prices. It gives you a range quickly, and shows which numbers would raise eyebrows.
Do not use it to pick an exact price. People are guessing about money they do not have to spend. It also works poorly when respondents have no sense of what the thing is or what it replaces, so show them a clear description first. Conjointly calls the method unsuitable for entirely new products, where people have no sense of a reasonable price. To compare two specific prices, use a mock purchase intent test.
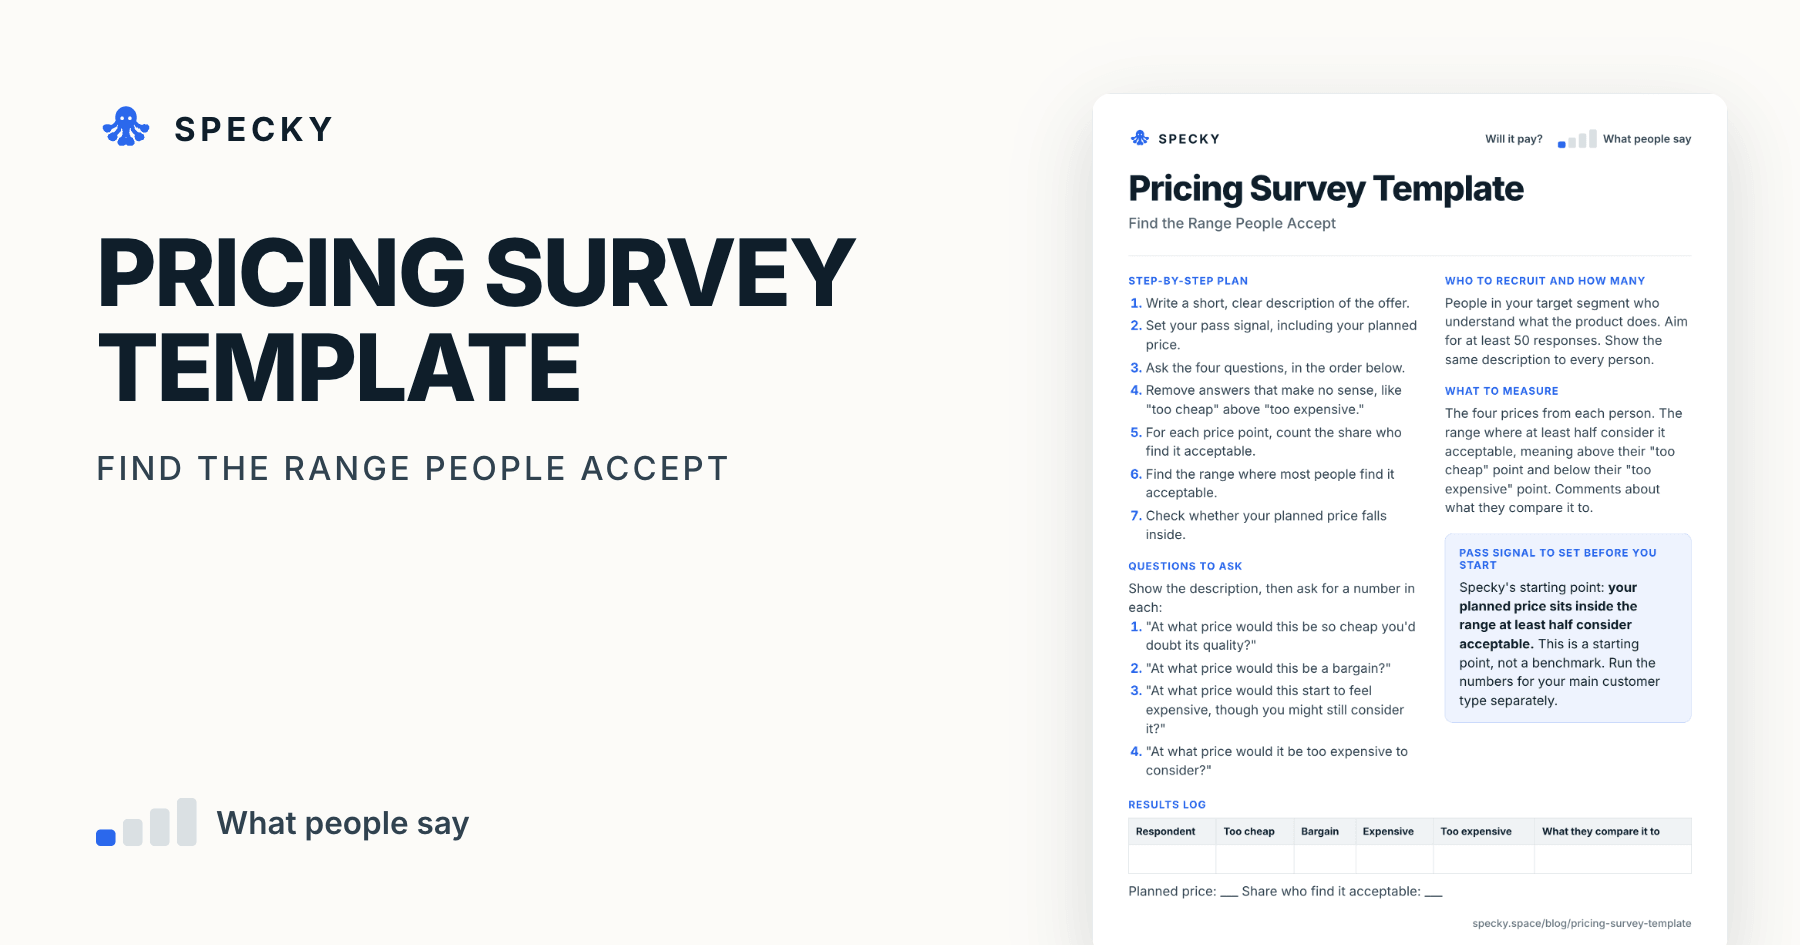
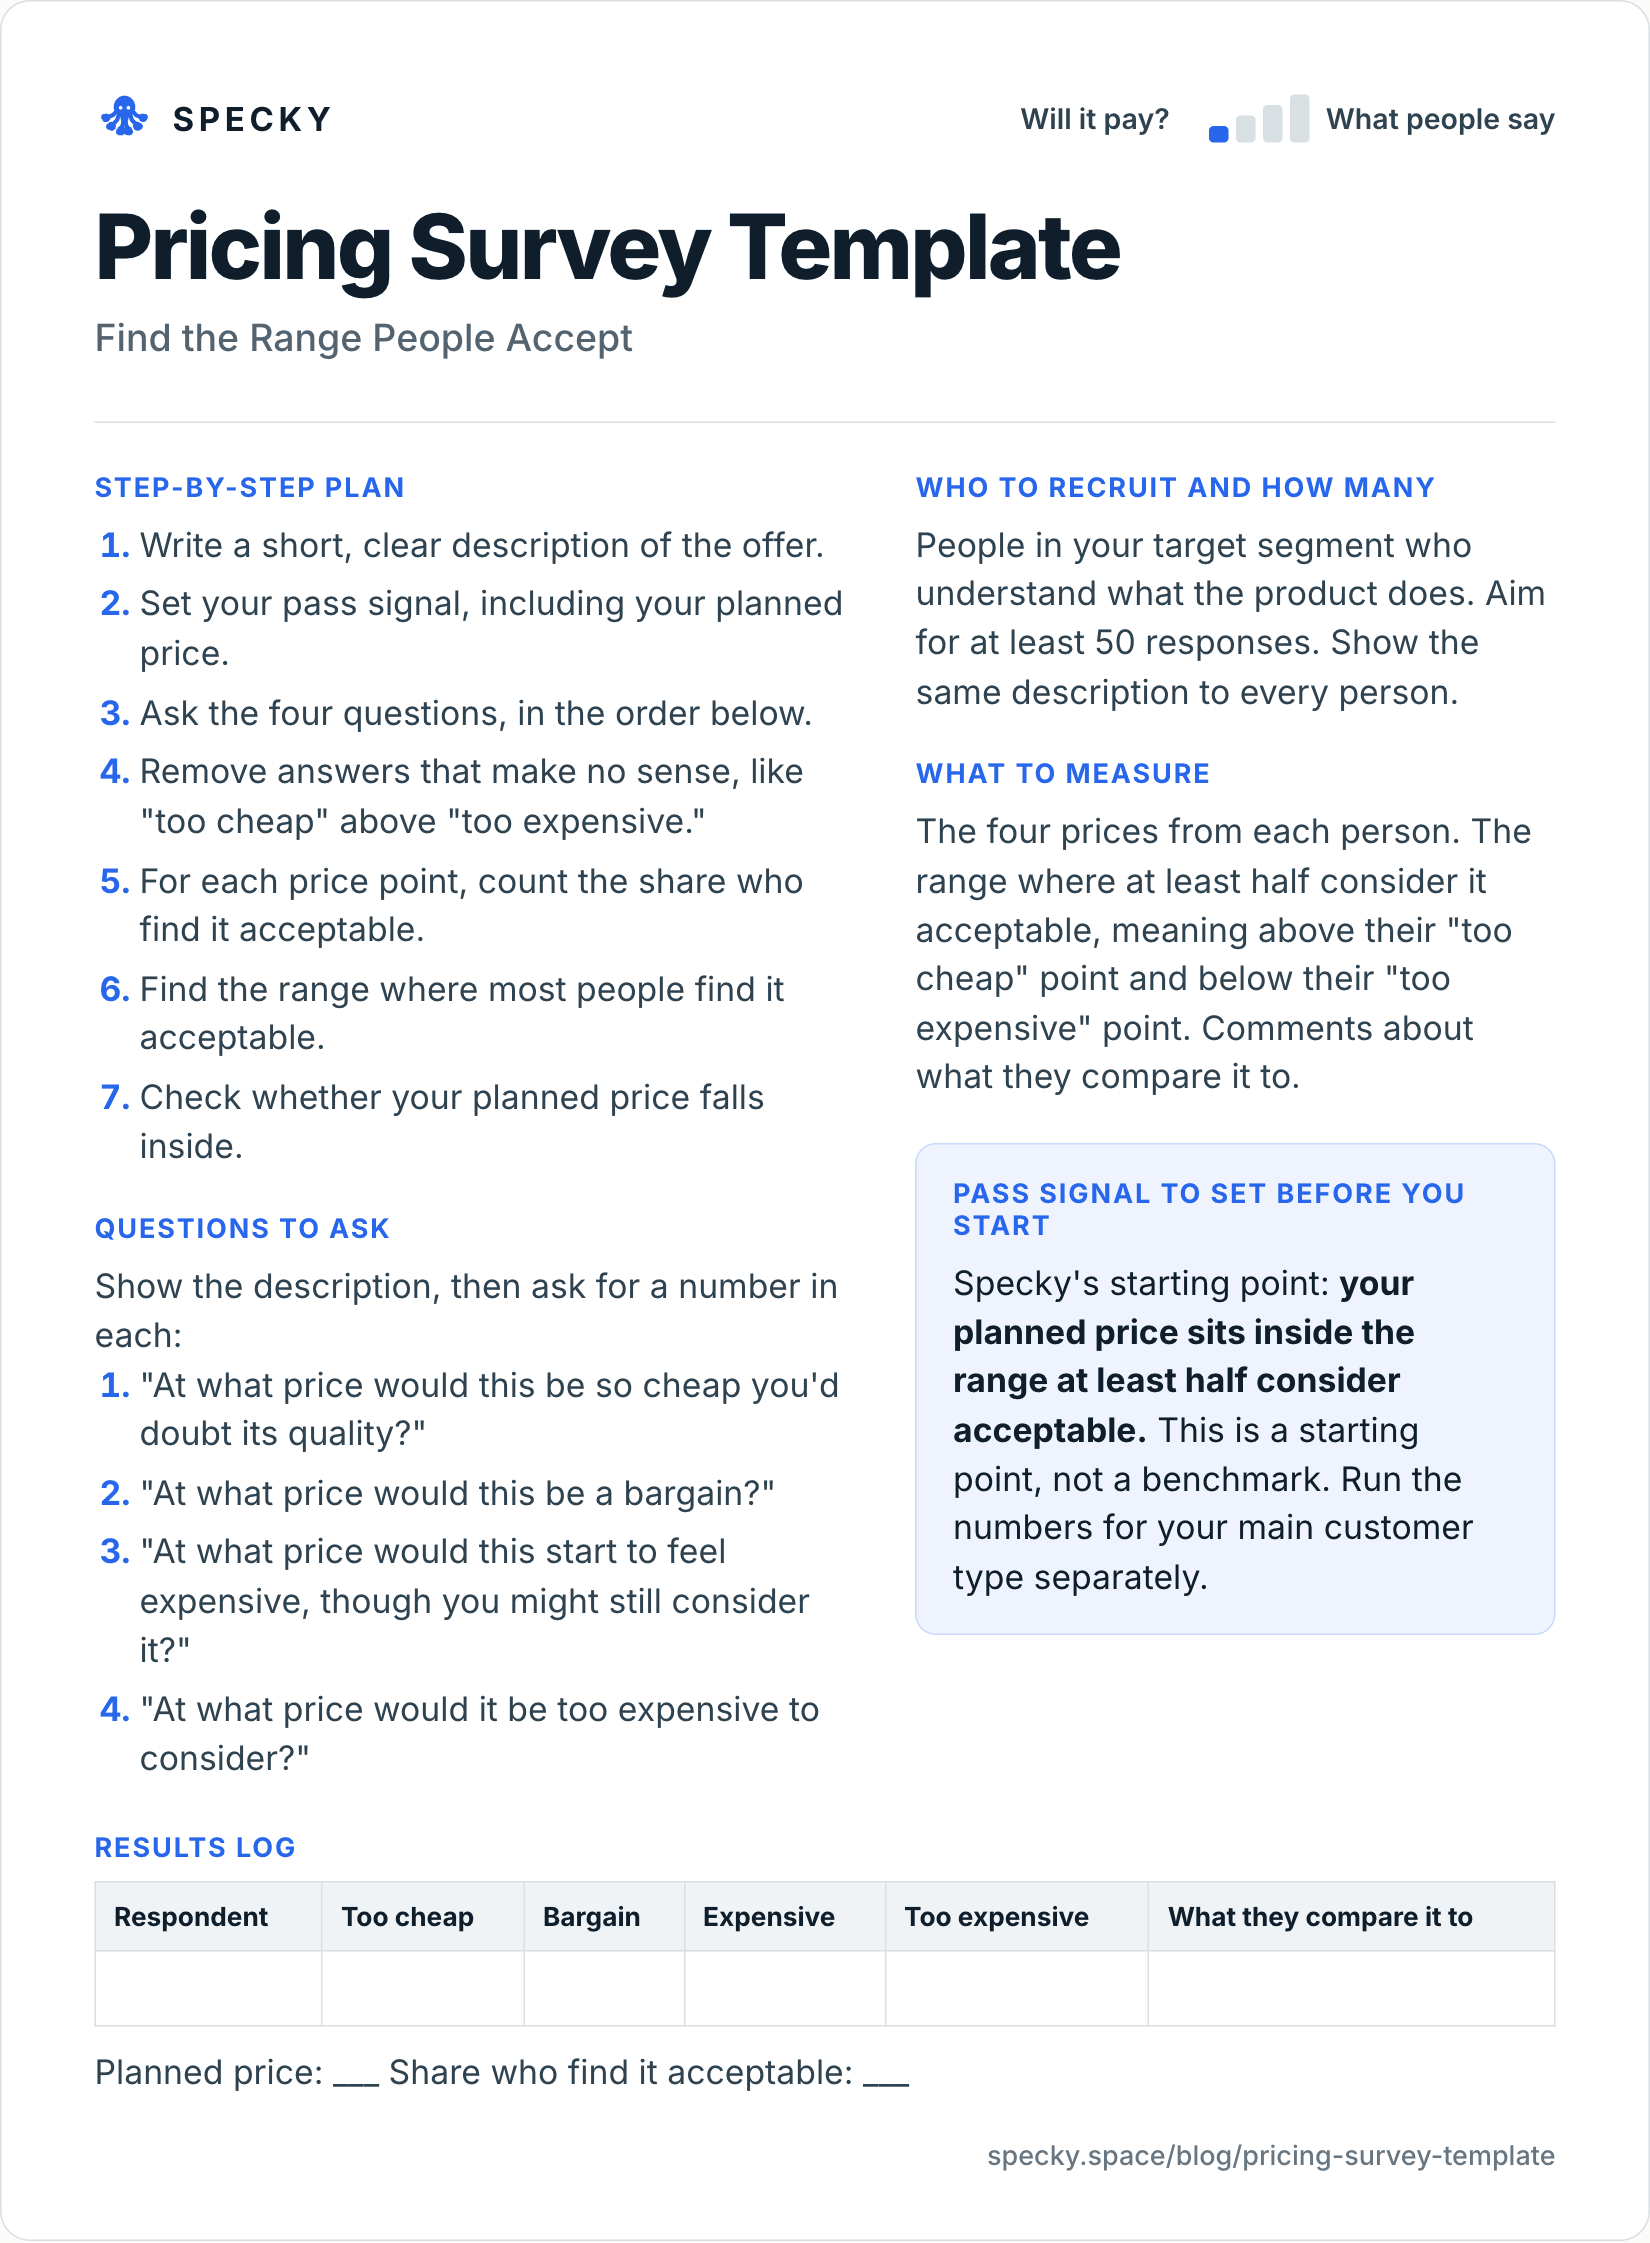
Copy-and-use pricing survey template
Open the image at full size, or copy the text version below.
Who to recruit and how many
People in your target segment who understand what the product does. Aim for at least 50 responses. Show the same description to every person.
Step-by-step plan
Write a short, clear description of the offer.
Set your pass signal, including your planned price.
Ask the four questions, in the order below.
Remove answers that make no sense, like "too cheap" above "too expensive."
For each price point, count the share who find it acceptable.
Find the range where most people find it acceptable.
Check whether your planned price falls inside.
Questions to ask
Show the description, then ask for a number in each:
"At what price would this be so cheap you'd doubt its quality?"
"At what price would this be a bargain?"
"At what price would this start to feel expensive, though you might still consider it?"
"At what price would it be too expensive to consider?"
Then add: "What do you pay today for the closest alternative?" and "Which type of buyer are you?" (your segments as options).
What to measure
The four prices from each person. The range where at least half consider it acceptable, meaning above their "too cheap" point and below their "too expensive" point. Comments about what they compare it to.
Pass signal to set before you start
Specky's starting point: your planned price sits inside the range at least half consider acceptable. This is a starting point, not a benchmark. Run the numbers for your main customer type separately.
Results log
Respondent
Too cheap
Bargain
Expensive
Too expensive
What they compare it to
Planned price: ___ Share who find it acceptable: ___
How do you analyse a Van Westendorp pricing survey?
You can do it in a spreadsheet.
Clean the data. Drop any response where the four prices are out of order (too cheap above bargain, bargain above expensive, expensive above too expensive). Note how many you dropped.
List candidate prices from the lowest to the highest answer, in even steps (for example every €5).
For each candidate price, compute four shares: the share who would call it too cheap, a bargain, expensive and too expensive. "Too cheap" and "bargain" fall as the price rises; "expensive" and "too expensive" rise.
Plot the four lines on one chart and read where they cross.
Check your planned price against the range, then repeat for each buyer type.
The crossings have names. Conjointly's definitions:
Point
Lines that cross
What it tells you
Point of marginal cheapness (PMC)
Too cheap and expensive
Bottom of the acceptable range
Optimal price point (OPP)
Too cheap and too expensive
Where equal shares find it too cheap and too expensive
Indifference price point (IPP)
Bargain and expensive
Where as many call it a bargain as call it expensive
Point of marginal expensiveness (PME)
Bargain and too expensive
Top of the acceptable range
Read the chart with care. Conjointly notes the lines look like demand curves but are only cumulative counts of answers, and the "optimal" points need not maximise revenue or profit (Conjointly). The template's simpler test, the share for whom your price sits between their "too cheap" and "too expensive" answers, asks the question you care about directly.
Can a pricing survey estimate revenue?
Only roughly. The Newton, Miller and Smith extension (1993) (Wikipedia) adds two questions asking how likely people are to buy, on a 1-5 scale, at their own "bargain" and "expensive" prices, and uses them to sketch a revenue curve. Conjointly calls those outputs very approximate. Treat them as a way to compare prices, not a forecast.
Van Westendorp vs Gabor-Granger: which pricing survey should you use?
"Would you buy this at €X?" yes or no, at set prices
Choose to buy at one of two prices, as if real
Output
An acceptable price range
A rough demand and revenue curve
Which of two prices wins
Price points
People name their own
5 evenly spaced (SurveyMonkey) or 8-15 (Conjointly)
2
Best when
You have no idea what to charge
You have a range and want to pick within it
You have two serious candidates
Weak spot
Unsuitable for entirely new products
One product, no competitors shown
Still not real money
Gabor-Granger is named for economists André Gabor and Clive Granger, who developed it in the 1960s (SurveyMonkey). The copyable version: show the same factual description, then ask "Would you buy this at €[price] a month?" starting at the lowest of five prices and moving up after each yes. For each price, the share who would buy at that price or higher is your demand line; price times that share is a simple revenue index. Conjointly's adaptive version randomises the starting price and moves up or down from there (Conjointly).
A sensible order: Van Westendorp to find the range, Gabor-Granger to choose within it, then a real offer.
Why can't you trust the exact numbers?
Because nobody pays, and the biases run both ways.
People overstate what they would pay in hypothetical questions. Across 28 stated-preference studies and 83 observations, hypothetical values ran about 1.35 times actual ones on the median. Choice-based formats, such as a yes or no at a set price, reduced the gap (Murphy et al., 2005).
People also understate the prices they name. Conjointly reports that Van Westendorp respondents tend to underestimate, and that in Gabor-Granger, understated prices and overstated purchase intent mostly cancel out.
The description moves the answer. SurveyMonkey warns that overselling the product inflates willingness to pay. Write the description in plain, factual terms and show everyone the same one.
So read the shape and the segment differences, not the exact euros.
How many responses do you need for a pricing survey?
Aim for at least 50 from your main segment, and more if you plan to split. At 50, a share near 50% has a margin of error of about ±14 points by the standard formula. Subgroups get noisy fast: in Pew's example, a subgroup of about 160 out of 1,067 carries about ±8 points instead of ±3 (Pew Research Center, 2016).
For Gabor-Granger, SurveyMonkey recommends at least 100 completed responses for each segment you report separately. If you sell to two very different buyers, budget for two samples.
Worked example (hypothetical)
This example is made up to show the method. A team is launching a bookkeeping tool for dentists, and plans to charge €89 a month. They survey 72 practice managers.
After removing six inconsistent answers, at least half find anything from about €35 to €70 acceptable. At €89, only 31% do. Several comments compare it to what they pay their accountant, which is a much higher number, but only for those who have one.
The planned price is outside the range, so the test fails. Before lowering it, the team looks at the group who have an accountant, where €89 sits comfortably inside, and rewrites the assumption around them.
Extending the example. Of the 66 clean responses, 23 come from practices with an accountant. In that group, about 6 in 10 find €89 acceptable; among the other 43, fewer than 2 in 10 do. But 23 responses carry a margin of about ±20 points, so "6 in 10" could be 4 in 10. The team does not declare victory. It offers the accountant group a paid pilot at €89 through a letter of intent, which turns a stated price into a signed one.
Common mistakes
Trusting a single number. This gives you a range, not a price.
Asking people with no context. Without a clear description, the answers are noise.
Overselling in the description. A glowing pitch raises the prices people name.
Keeping nonsense answers. Remove responses where the order makes no sense.
Averaging different buyers. Split them by type.
Treating the "optimal price point" as optimal. It is where two answer curves cross, not where revenue peaks.
Stopping here. Test the range with a real offer next.
How to run it in Specky
On the Assumptions page, click the note and choose Pick a test, then Pricing survey. Specky fills in the steps, the pass signal, and a one-week timeline.
Click Test with a page. Specky builds a Feature interest page and collects responses. The page has one open answer box, so people would have to put all four prices in one reply, which is awkward to analyze.
For clean numbers, use your survey tool. If you connect Typeform, responses come in with your other evidence.
Click Start running, attach your calculated range, and record the result.
A pass shows as Early signal on the board, not Supported, because stated prices are opinion.
What to do with each outcome
Supported (shows as Early signal): Your price is in the range. Test it with a real offer using a letter of intent or a concierge test. Strategyzer's experiment library lists the mock sale, letter of intent and presale as validation experiments for exactly this step.
Unclear: The range is very wide, or differs across groups. Split the data by customer type.
Contradicted: Your price is outside the range. Change the price, change the package, or change the customer. Any bet resting on this note now shows as Contradicted.
Not sure which customer feels the problem most? Run a discovery survey before pricing. If the product is live, survey the users who would be "very disappointed" without it in your product-market fit survey first.
Frequently asked questions
What is the Van Westendorp pricing method?
The Van Westendorp Price Sensitivity Meter is a survey method from 1976 that asks four questions about when a price feels too cheap, a bargain, expensive, and too expensive. Plotting the answers gives an acceptable price range, from the point of marginal cheapness to the point of marginal expensiveness. It was introduced by Dutch economist Peter van Westendorp.
What questions should a pricing survey ask?
After a short, factual description, ask the four Van Westendorp questions: the price at which it would be so cheap you'd doubt its quality, a bargain, starting to feel expensive, and too expensive to consider. Then ask what they pay for the closest alternative and which type of buyer they are.
How many responses do you need for a pricing survey?
Aim for at least 50 responses from your target segment, which gives a margin of about ±14 points on a share. If you have different types of buyers, you need enough from each to read them separately; SurveyMonkey recommends at least 100 per segment for Gabor-Granger.
Should I use Van Westendorp or Gabor-Granger?
Use Van Westendorp when you have no idea what to charge and want an acceptable range. Use Gabor-Granger when you already have a range and want to see how demand drops as the price rises across five or more set prices. Many teams run Van Westendorp first, then Gabor-Granger within the range it finds.
Can a pricing survey tell me what to charge?
A pricing survey can give you a range, but not an exact price. Stated prices are opinions, and the biases run both ways: people overstate what they would pay in hypothetical questions and understate the thresholds they name. Confirm your price with a real offer, such as a letter of intent or a presale.